The cash flow diagram of Alternative-2 is shown here again for ready reference.
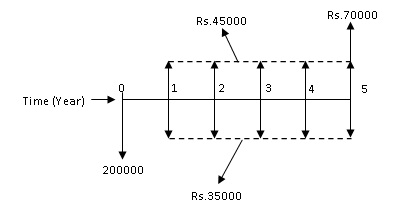
Fig. 2.4 Cash flow diagram of Alternative -2
Now the equivalent uniform annual worth of Alternative-2 i.e. AW 2 is calculated as follows;
![]()
![]()
For alternative-2, Rs.35000 and Rs.45000 are annual amounts.
Now putting the values of different compound interest factors in the above expression;
![]()
![]()
AW2= - Rs.31294
From this comparison, it is observed that Alternative-1 will be selected as it shows lower negative equivalent uniform annual worth compared to Alternative-2. This outcome is in consistent with the outcome obtained by present worth method in Example-2.
Example -11
A material supply contractor has two options (i.e. from two different manufacturing companies, Company-1 and Company-2) to purchase a tractor for supply of construction materials. The details of cash flow of the two options are given below;
Company-1 Tractor: Initial purchase cost = Rs.2000000, Annual operating cost including labor and maintenance = Rs.50000, Cost of new set of tires to be replaced at the end of year ‘3', year ‘6'and year ‘9' = Rs.110000 each, Expected salvage value = Rs.520000, Useful life = 10 years.
Company-2 Tractor: Initial purchase cost = Rs.2200000, Annual operating cost including labor and maintenance = Rs.27000, Cost of new set of tires to be replaced at the end of year ‘4' and year ‘8' = Rs.120000 each, Expected salvage value = Rs.700000, Useful life = 10 years.
Determine which company tractor should be selected on the basis of equivalent uniform annual worth at the interest rate of 12% per year.