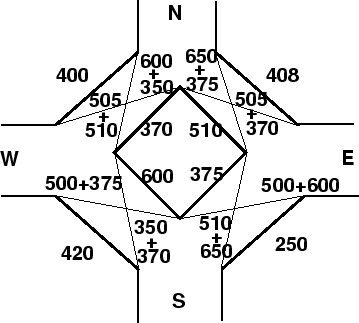
The traffic from the four approaches negotiating through the roundabout
is illustrated in figure 1.
Figure 1:
Traffic negotiating a rotary
Weaving width is calculated as, w =
= 13.5 m
Weaving length, l is calculated as = 4w = 54 m
The proportion of weaving traffic to the non-weaving traffic in all the
four approaches is found out first.
It is clear from equation,that the highest proportion of
weaving traffic to non-weaving traffic will give the minimum capacity.
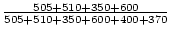
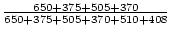
Let the proportion of weaving traffic to the non-weaving traffic in West-North
direction be denoted as , in North-East direction as , in the
East-South direction as , and finally in the South-West direction as
.
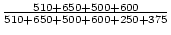
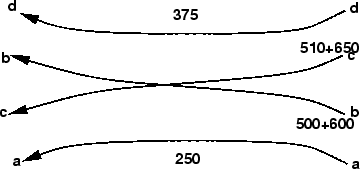
The weaving traffic movements in the East-South direction is shown in
figure 2. Then using equation,
=
=
=0.783
=
=
=0.718
=
=
=0.674
=
=
=0.6099
Thus the proportion of weaving traffic to non-weaving traffic is highest
in the East-South direction.
Figure 2:
Traffic weaving in East-South direction
Therefore, the capacity of the rotary will be capacity of this weaving
section.
From equation,


![$[\frac{e_1+e_2}{2}]+3.5$](img2.gif) = 13.5 m
= 13.5 m
 w = 54 m
 , in North-East direction as
  , in the
East-South direction as
, in the
East-South direction as  , and finally in the South-West direction as
 .
.
 =
=
 =0.783
 =
=
 =0.718
 =
=
 =0.674
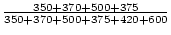 =
=
 =0.6099
![\begin{displaymath}
Q_{ES}= \frac{280\times
13.5[1+\frac{10}{13.5}][1-\frac{0.783}{3}]}{1+\frac{13.5}{54}} = 2161.164
veh/hr.
\end{displaymath}](img17.gif)