| |
| | |
|
The Concessionaire shall provide required number of Toll Plazas for collection
of toll as per the Concession Agreement.
The fee collection system shall be speedy, efficient and user friendly.
The design of the Toll Plazas should be such that they are aesthetically
pleasing and efficient and the fee collection staff should be quick, courteous
and adequately trained before deployment.
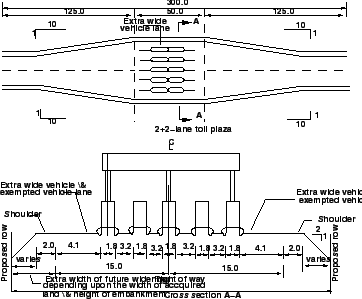
Fig. 1 shows the general toll plaza geometry of
a 2+2 lane toll plaza.
Initially, the numbers of lanes become equal to the number of tollbooths, which
is equal to three in Fig. 1, in the queueing
area.
After the vehicle crosses the tollbooth, the number of lanes merges back to the
original width of the highway, i.e. two-lane.
A lane for the extra wide and the exempted vehicles is provided at the left hand
side of the highway.
Some extra space is also maintained for the scope of future plaza expansion.
The design specifications for the design of the flared portions are as listed
below:
- Lane width = 3.2 m in general and 4.1 m for oversize vehicles.
- Median (a) Width = 1.8 m (b) Length = 50 m
- Transition - 1 in 10 may be provided from two-lane section to the widened
width at Toll Plaza on either side.
Figure 1:
General Layout 2+2 lane Toll Plaza (Source: [3])
 |
As discussed previously, tollbooths are erected to collect the tax from the road
users.
The number of tollbooths depends on the flow of vehicles on the facility.
Following guidelines are generally followed while deciding the number of toll
lanes in a toll plaza:
- Peak Hour Factor: Percentage of vehicles travelling during the peak hour
to the average daily traffic.
- Number of toll lanes should be corresponding to the forecast traffic for
at least 5 years.
- Forecast traffic in terms of veh/day for all the tollable categories.
Non-tollable vehicles (e.g. VIP vehicles, ambulances, etc) are exempted from the
toll tax and flow through a separate lane.
- If the queue becomes so long that the waiting time exceeds three minutes
then the number of tollbooths need to be increased.
Table 1:
Number of Semi Automatic Toll gates in each direction, Source: [3]
| Forecast Traffic |
Peak Hour Factor |
| (in vehicles/day) total |
6% |
7% |
8% |
9% |
| of both directions |
|
|
|
|
| Less than 7000 |
2 |
2 |
2 |
2 |
| 7000-12000 |
2 |
2 |
3 |
3 |
| More than 12000 |
3 |
3 |
4 |
4 |
|
|
| | |
|
|
|