|
The entire toll plaza area can be divided into two areas namely queueing and the
merging area.
The vehicles line up to pay the toll in the queueing area.
The vehicles wait for their turn to pay the toll at the toll booth.
The delay is called as the queueing delay.
Similarly, once the vehicle crosses the toll booth, the number of lanes reduces
from number of tollbooths to the original width of the highway.
A vehicle travelling in a lane has to wait or slow down to allow another vehicle
in the adjacent lane to pass.
These kind of delays are termed as merging delays.
We will apply Queueing Theory to ascertain the delays in both the areas.
Keeping the total delay time to be minimum, we find the optimal number of tollbooths for the system.
The time wasted at the tollbooth  is given by the
equation. 1: is given by the
equation. 1:
 |
(1) |
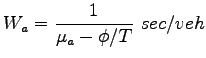
where,  = Service rate at a tollbooth (veh/hr), = Service rate at a tollbooth (veh/hr),  = Total traffic flow (veh/hr), = Total traffic flow (veh/hr),  = Number of tollbooths = Number of tollbooths
Similarly, the time wasted at merging area is calculated using the following
logic.
If there are tollbooths which are finally merged into  lanes of highway then the number of merging points are given by lanes of highway then the number of merging points are given by  (see
Fig. 1). (see
Fig. 1).
Figure 1:
Merging points and conflicting lanes
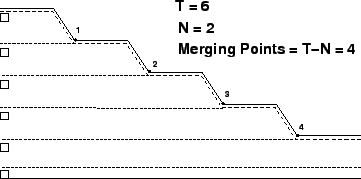 |
From Fig. 1 we can see that in a toll plaza with a side merging layout which has tollbooths, the first merging point takes a stream coming from 2 tollbooths, and the second merging point would take a stream from 3.
By Little's theorem, the average waiting time in the system
 is given by the equation. 2:
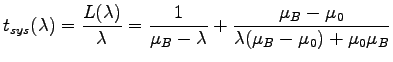 |
(2) |
The average wasted time of a driver at a merging point is the difference between
 and the time he or she would spend on a normal lane.
The expected time a driver spends when no merging happens is and the time he or she would spend on a normal lane.
The expected time a driver spends when no merging happens is  .
Hence, the average wasted time is given by the
equation. 3. .
Hence, the average wasted time is given by the
equation. 3.
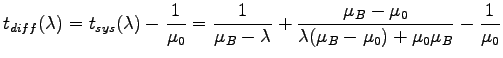 |
(3) |
where,  = Service rate when merging of vehicles takes place (veh/hr), = Service rate when merging of vehicles takes place (veh/hr),  = Service rate when no merging of vehicles takes place (veh/hr), = Service rate when no merging of vehicles takes place (veh/hr),  = Vehicle arrival rate = = Vehicle arrival rate =
 (veh/hr), (veh/hr),  = No. of conflicting lanes at a merging point.
has a range between = No. of conflicting lanes at a merging point.
has a range between
![$ [2, T-N+1]$](img19.png)
The above formula gives the average wasted time of a driver at each merging point.
The overall wasted time is the weighted sum of all the wasted time at each merging point, where the corresponding weight is the probability for a driver to reach that point.
The overall wasted time  can be calculated using the equation. 4. can be calculated using the equation. 4.
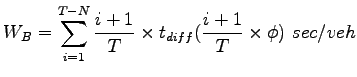 |
(4) |
As per the optimal toll plaza configuration, we need to keep the total delay
time as minimum [4].
The Total Wasted Time
 for the vehicle (Tollbooth + Merging) is
given by the equation. 5: for the vehicle (Tollbooth + Merging) is
given by the equation. 5:
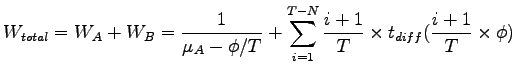 |
(5) |
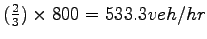
Calculate the Total delay time in toll plaza if the total no of tolls are 3 on a single-lane highway.
The total traffic flow on the highway is 800 veh/hr. Assume the following data: Service rate of Tollbooth = 400 veh/hr; Service rate when merging of vehicles takes place =1500 veh/hr;
Service rate when no merging of vehicles takes place =2500 veh/hr
The following data has been given to us in the problem: N=1 lane; Ø= 800 veh/hr;  = 400 veh/hr; = 1500 veh/hr; = 2500 veh/hr.
Our aim is to determine the total delay time in toll plaza.
From eqn above ; = 400 veh/hr; = 1500 veh/hr; = 2500 veh/hr.
Our aim is to determine the total delay time in toll plaza.
From eqn above ;
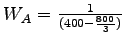 =0.0075 hr/veh = 27 sec/veh.
It means that the wasted time at the tollbooth is 27 sec/veh.
Now we move on to find the overall wasted time in the merging area (WB).
To find that, first we need to find the wasted time at each merging point which can be calculated using the equation.
Now, eqn uses a term k in it which signifies the number of conflicting lanes at each merging point.
k ranges between [2, T-N+1].
Therefore in this case (T=3) k lies between [2, 4-1+1], i.e. [2,3]
When K=2:
Hence, at first merging point = =0.0075 hr/veh = 27 sec/veh.
It means that the wasted time at the tollbooth is 27 sec/veh.
Now we move on to find the overall wasted time in the merging area (WB).
To find that, first we need to find the wasted time at each merging point which can be calculated using the equation.
Now, eqn uses a term k in it which signifies the number of conflicting lanes at each merging point.
k ranges between [2, T-N+1].
Therefore in this case (T=3) k lies between [2, 4-1+1], i.e. [2,3]
When K=2:
Hence, at first merging point =
 .
From eqn above, for .
From eqn above, for
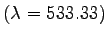
![$ T_{diff}=\frac{1}{(1500-2\times\frac{800}{3})}+\frac{(1500-2500)}{[2\times\frac{800}{3}(1500-2500)+1500\times 2500]}-\frac{1}{2500}$](img28.png) = 1.166 sec. = 1.166 sec.
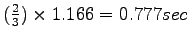
WB for the 1st merging point =
 When K=3:


tsys = 2.48 sec.
WB for the 2st merging point =
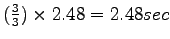 .
Total WB=0.777+2.48.
WB= 3.257 sec.
Wtotal=WA+WB=27.0+3.257.
Total delay time Wtotal = 30.257 sec. .
Total WB=0.777+2.48.
WB= 3.257 sec.
Wtotal=WA+WB=27.0+3.257.
Total delay time Wtotal = 30.257 sec.
Calculate the optimum number of tollbooths to be
installed on a toll plaza, proposed to be built on a single-lane highway.
The total traffic flow on the highway is 900 veh/hr.
Assume the following data:
Service rate of Tollbooth = 350 veh/hr;
Service rate when merging of vehicles takes place = 1184.9 veh/hr; and
Service rate when no merging of vehicles takes place = 3017.1 veh/hr.
The following data has been given to us in the problem:
=1 lane; = 900 veh/hr; = 350 veh/hr; = 1184.9 veh/hr;
= 3017.1 veh/hr
Our aim should be to determine the total vehicle delays for different
values of tollbooths  .
The value of corresponding to which the delay time in minimum is the optimal
condition.
Let us initially start with =4;
From equation. 1; .
The value of corresponding to which the delay time in minimum is the optimal
condition.
Let us initially start with =4;
From equation. 1;  = 1/(350 – 900/4) =
0.008 hr/veh = 28.8 sec/veh.
It means that the wasted time at the tollbooth is 28.8 sec/veh.
Now we move on to find the overall wasted time in the merging area ( = 1/(350 – 900/4) =
0.008 hr/veh = 28.8 sec/veh.
It means that the wasted time at the tollbooth is 28.8 sec/veh.
Now we move on to find the overall wasted time in the merging area ( ).
To find that, first we need to find the wasted time at each merging point which
can be calculated using the equation. 3.
Now, equation. 3 uses a term k in it which signifies
the number of conflicting lanes at each merging point.
It can be seen from figure 4 that k ranges between
.
Therefore in this case (=4) k lies between [2, 4-1+1], i.e. [2,4].
Hence, at first merging point = (2/4) * 900 = 450 veh/hr.
From equation. 3, ).
To find that, first we need to find the wasted time at each merging point which
can be calculated using the equation. 3.
Now, equation. 3 uses a term k in it which signifies
the number of conflicting lanes at each merging point.
It can be seen from figure 4 that k ranges between
.
Therefore in this case (=4) k lies between [2, 4-1+1], i.e. [2,4].
Hence, at first merging point = (2/4) * 900 = 450 veh/hr.
From equation. 3,

![$ T_{diff} = 1/(1184.9 - 2 \times 900/4) + (1184.9 - 3017.1)/[2
\times 900/4(1184.9 - 3017.1) + 1184.9 \times 3017.1] - 1/3017.1 = 1.307$](img37.png) sec. sec.
Similarly, at second merging point = (3/4) * 900 = 675 veh/hr and
at third merging point = (4/4) * 900 = 900 veh/hr.
Using equation. 3, the values of  can be
found out at second and third merging points.
at second merging point, (=675) = 3.046 sec.
at third merging point, (=900) = 8.018 sec.
Now the overall wasted time in merging () is given by the
equation. 4 which is the product of the weighted
mean of the merging point with the values.
Hence,
= (2/4) * 1.307 + (3/4) * 3.046 + (4/4) * 8.018 = 6.176 sec.
Now, can be
found out at second and third merging points.
at second merging point, (=675) = 3.046 sec.
at third merging point, (=900) = 8.018 sec.
Now the overall wasted time in merging () is given by the
equation. 4 which is the product of the weighted
mean of the merging point with the values.
Hence,
= (2/4) * 1.307 + (3/4) * 3.046 + (4/4) * 8.018 = 6.176 sec.
Now,  can be calculated from equation. 5
which is sum of and .
= 28.8 + 6.176 = 34.976 sec.
So, for the case of =4, the total wasted time is 34.976 secs.
Following the same procedure to calculate for different values of
.
For faster calculation purposes, we can use Microsoft Excel to compute the
values of , , and .
Following are the wasted times for different vaules of .
We can clearly see that the total delay is minimum for the configuration =6.
Hence 6 tollbooths is the optimal solution for the given highway facility. can be calculated from equation. 5
which is sum of and .
= 28.8 + 6.176 = 34.976 sec.
So, for the case of =4, the total wasted time is 34.976 secs.
Following the same procedure to calculate for different values of
.
For faster calculation purposes, we can use Microsoft Excel to compute the
values of , , and .
Following are the wasted times for different vaules of .
We can clearly see that the total delay is minimum for the configuration =6.
Hence 6 tollbooths is the optimal solution for the given highway facility.
Table 1:
Total wasted time for different number of tollbooth
|
|
 |
|
|
| 4 |
28.8 |
12.371 |
6.176 |
34.976 |
| 6 |
18 |
16.403 |
13.839 |
31.839 |
| 8 |
15.15 |
20.436 |
16.805 |
31.955 |
| 10 |
13.846 |
24.476 |
19.815 |
33.661 |
|
|