| |
| | |
|
This results in the most accurate and realistic data.
In this case of survey, every parking stall is monitored at a continuous
interval of 15 minutes or so and the license plate number is noted down.
This will give the data regarding the duration for which a particular vehicle
was using the parking bay.
This will help in calculating the fare because fare is estimated based on the
duration for which the vehicle was parked.
If the time interval is shorter, then there are less chances of missing
short-term parkers.
But this method is very labor intensive.
The parking survey data collected from a parking lot by license plate method is
s shown in the table 1 below.
Find the average occupancy, average turn over, parking load, parking capacity
and efficiency of the parking lot.
Table 1:
Licence plate parking survey data
| Bay |
Time |
| |
0-15 |
15-30 |
30-45 |
45-60 |
| 1 |
1456 |
9813 |
- |
5678 |
| 2 |
1945 |
1945 |
1945 |
1945 |
| 3 |
3473 |
5463 |
5463 |
5463 |
| 4 |
3741 |
3741 |
9758 |
4825 |
| 5 |
1884 |
1884 |
- |
7594 |
| 6 |
- |
7357 |
- |
7893 |
| 7 |
- |
4895 |
4895 |
4895 |
| 8 |
8932 |
8932 |
8932 |
- |
| 9 |
7653 |
7653 |
8998 |
4821 |
| 10 |
7321 |
- |
2789 |
2789 |
| 11 |
1213 |
1213 |
3212 |
4778 |
| 12 |
5678 |
6678 |
7778 |
8888 |
See the following table for solution 2.
Table 2:
Licence plate parking survey solution
| Bay |
Time |
Time |
|
| (1) |
(2) |
(3) |
(4) |
(5) |
(6) |
(7) |
(8) |
(9) |
(10) |
| |
15 |
30 |
45 |
60 |
15 |
30 |
45 |
60 |
Turn over |
| 1 |
1456 |
9813 |
- |
5678 |
1 |
1 |
0 |
1 |
3 |
| 2 |
1945 |
1945 |
1945 |
1945 |
1 |
1 |
1 |
1 |
1 |
| 3 |
3473 |
5463 |
5463 |
5463 |
1 |
1 |
1 |
1 |
2 |
| 4 |
3741 |
3741 |
9758 |
4825 |
1 |
1 |
1 |
1 |
3 |
| 5 |
1884 |
1884 |
- |
7594 |
1 |
1 |
0 |
1 |
2 |
| 6 |
- |
7357 |
- |
7893 |
0 |
1 |
0 |
1 |
2 |
| 7 |
- |
4895 |
4895 |
4895 |
0 |
1 |
1 |
1 |
1 |
| 8 |
8932 |
8932 |
8932 |
- |
1 |
1 |
1 |
0 |
1 |
| 9 |
7653 |
7653 |
8998 |
4821 |
1 |
1 |
1 |
1 |
3 |
| 10 |
7321 |
- |
2789 |
2789 |
1 |
0 |
1 |
1 |
2 |
| 11 |
1213 |
1213 |
3212 |
4778 |
1 |
1 |
1 |
1 |
3 |
| 12 |
5678 |
6678 |
7778 |
8888 |
1 |
1 |
1 |
1 |
4 |
| |
Accumulation |
|
|
|
10 |
11 |
9 |
11 |
|
| |
Occupancy |
|
|
|
0.83 |
0.92 |
0.75 |
0.92 |
2.25 |
Columns 1 to 5 is the input data.
The parking status in every bay is coded first.
If a vehicle occupies that bay for that time interval, then it has a code 1.
This is shown in columns 6, 7, 8 and 9 of the table corresponding to the time
intervals 15, 30, 45 and 60 seconds.
- Turn over is computed as the number of vehicles present in that bay for
that particular hour.
For the first bay, it is counted as 3.
Similarly, for the second bay, one vehicle is present throughout that hour and
hence turnout is 1 itself.
This is being tabulated in column 10 of the table.
Average turn over =
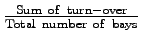 = 2.25 = 2.25
- Accumulation for a time interval is the total of number of vehicles in
the bays 1 to 12 for that time interval.
Accumulation for first time interval of 15 minutes = 1+1+1+1+1+0+0+1+1+1+1+1 =
10
- Parking volume = Sum of the turn over in all the bays = 27 vehicles
- Average duration is the average time for which the parking lot was used
by the vehicles.
It can be calculated as sum of the accumulation for each time interval
 time interval divided by the parking volume =
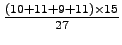 = 22.78 minutes/vehicle.
- Occupancy for that time interval is accumulation in that particular
interval divided by total number of bays.
For first time interval of 15 minutes, occupancy = (10100)/12 = 83%
Average occupancy is found out as the average of total number of vehicles
occupying the bay for each time interval. It is expressed in percentage.
Average occupancy =
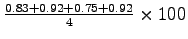 = 85.42%. = 85.42%.
- Parking capacity = number of bays number of hours = 12 1
= 12 vehicle hours
- Parking load = total number of vehicles accumulated at the end of each
time interval time =
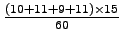 = 10.25
vehicle hours = 10.25
vehicle hours
- Efficiency =
 = =
 = 85.42%. = 85.42%.
|
|
| | |
|
|
|