Before taking any measures for the betterment of conditions, data regarding
availability of parking space, extent of its usage and parking demand is
essential.
It is also required to estimate the parking fares also.
Parking surveys are intended to provide all these information.
Since the duration of parking varies with different vehicles, several
statistics are used to access the parking need.
The following parking statistics are normally important.
Parking accumulation: It is defined as the number of vehicles
parked at a given instant of time.
Normally this is expressed by accumulation curve.
Accumulation curve is the graph obtained by plotting the number of bays
occupied with respect to time.
Parking volume: Parking volume is the total number of vehicles
parked at a given duration of time.
This does not account for repetition of vehicles.
The actual volume of vehicles entered in the area is recorded.
Parking load : Parking load gives the area under the
accumulation curve.
It can also be obtained by simply multiplying the number of vehicles occupying
the parking area at each time interval with the time interval.
It is expressed as vehicle hours.
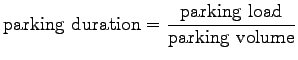
Average parking duration: It is the ratio of total vehicle hours
to the number of vehicles parked.
(1)
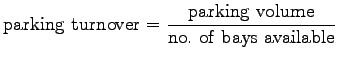
Parking turnover: It is the ratio of number of vehicles parked in
a duration to the number of parking bays available.
This can be expressed as number of vehicles per bay per time duration.
(2)
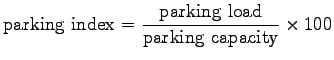
Parking index: Parking index is also called occupancy or
efficiency.
It is defined as the ratio of number of bays occupied in a time duration to the
total space available.
It gives an aggregate measure of how effectively the parking space is utilized.
Parking index can be found out as follows
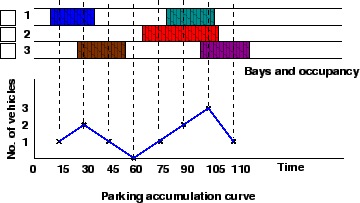
To illustrate the various measures, consider a small example in
figure 1, which shows the duration for which each of the bays are
occupied(shaded portion). Now the accumulation graph can be plotted by simply
noting the number of bays occupied at time interval of 15, 30, 45 etc. minutes
is shown in the figure.
Figure 1:
Parking bays and accumulation curve
The various measures are calculated as shown below:
Parking volume is given as 5 vehicles.
Parking load is given as
=
= 2.75 veh hour.
Average parking duration is computed as
= 33 minutes.
Parking turnover is obtained as
= 0.83 veh/hr/bay.
Parking index is calculated as
=
45.83%