-
To run an IR spectrum, the sample is either dissolved in a solvent such as CHCl3 (chloroform) that has few IR absorptions, pressed into a transparent disc with powdered solid KBr, or ground into an oily slurry called a mull with a hydrocarbon oil called ‘Nujol'. Solutions in CHCl3 cannot be used for looking at the regions of C–Cl bond stretching nor can Nujol mulls be used for the region of C–H stretching. KBr is however transparent to infrared radiation.
-
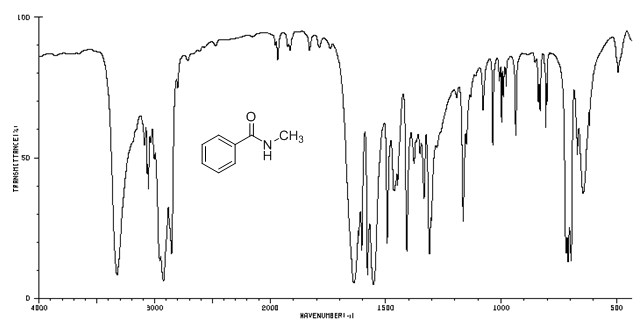
An IR spectrum is usually recorded between 1000-4000 cm-1 and it may classify into broad regions- the functional group region and the fingerprint region. Typically, an IR spectrum is a plot of transmittance (%T) vs. wavenumber. Transmittance is related to absorbance (A) as follows:
A = log 10 1/T
-
The functional group region (4000-1500 cm-1) contains information about the different functional groups. The various functional groups and their regions are given the following diagram.
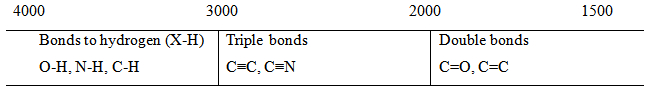
• In the X-H bond region, normally the signals that are looked for are those of C(Ar) -H, C (sp) -H, N-H, O-H. The C (sp3) -H usually occurs at the borderline (2900-3000 cm-1).
A group gives an independent vibration only if both bond strength and reduced mass are different from those of neighbouring bonds. The IR peak of an NH group is fundamentally different from that of an NH2 group. In the case of N–H, this is likely to be true and a sharp peak appears at about 3300 cm-1 , whether the NH group is part of a simple amine (R2NH) or an amide (RCONHR). The NH2 group is also independent of the rest of the molecule, but the two NH bonds inside the NH2 group have identical force constants and reduced masses and so vibrate as a single unit. Two equally strong bands appear one for the two N–H bonds are vibrating in phase (symmetric) and one for the two N–H bonds vibrating in opposition (antisymmetric). The antisymmetric vibration requires