Disproportionation: It is a specific type of redox reaction in which a species simultaneously reduced and oxidized to form two different species with lower and higher oxidation sate.

A species has a tendency to disproportionate into its two neighbours if the potential on the right of the species in a Latimer diagram is higher than that on the left.
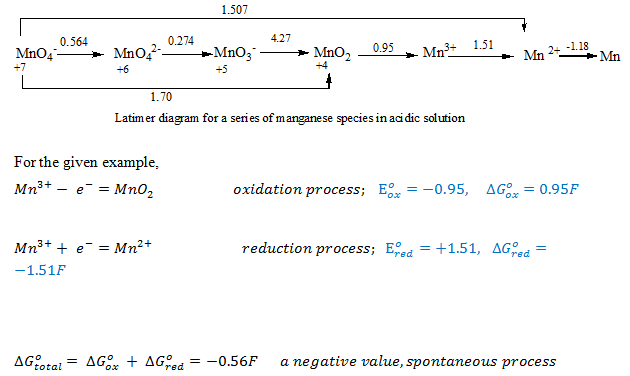
Q. MnO42− undergoes disproportionation reaction. Find out the change in free energy for the disproportionation process and find out the equilibrium constant ( k )?
Hints: Find out Δ G°total from the Latimer diagram shown above (Δ G°total = − 3.40 F) and then from the equation Δ G° = − RTlnk find out k at 298° K.
k = 3.2 X 10⁹
Q. A part of Latimer diagram is,

Does hydrogen peroxide have a tendency to disproportionate in acid solution?
Frost Diagrams:
Frost or oxidation state diagrams plot the relative free energy of a species versus oxidation state. These diagrams visually show quite a bit about the properties of the different oxidation states of a species. Frost diagrams can be constructed from Latimer diagrams. The values to be plotted on the y-axis are obtained by multiplying the number of electrons transferred during an oxidation state change by the standard reduction potential for that change.
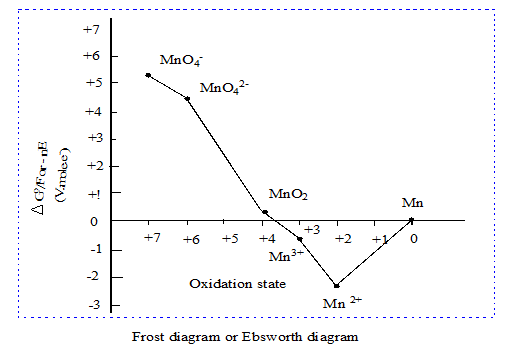
Figure 5.1. Frost diagram for MnO4− to Mn system.
Utility and limitation of Frost Diagram:
- Thermodynamic stability is found at the bottom of the diagram. Thus, the lower a species is positioned on the diagram, the more thermodynamically stable it is (from a oxidation-reduction perspective) Mn (II) is the most stable species.
- A species located on a convex curve can undergo disproportionation
MnO42− and Mn (III) tends to disproportionate. - Those species on a concave curve do not typically disproportionate. MnO2 does not disproportionate
- Any species located on the upper left side of the diagram will be a strong oxidizing agent.
MnO4− is a strong oxidizer. - Any species located on the upper rignt side of the diagram will be a reducing agent.
manganese metal is a moderate reducing agent - These diagrams describe the thermodynamic stability of the various species.
Although a given species might be thermodynamically unstable toward reduction, the kinetics of such a reaction might be very slow.
Although it is thermodynamically favourable for permanganate ion to be reduced to Mn (II) ion, the reaction is slow except in the presence of a catalyst. Thus, solutions of permanganate can be stored and used in the laboratory - The information obtained from a Frost diagram is for species under standard conditions (pH=0 for acidic solution and pH=14 for basic solution).
Changes in pH may change the relative stabilities of the species. The potential of any process involving the hydrogen ion will change with pH because the concentration of this species is changing. Under basic conditions aqueous Mn2+ does not exist. Instead Insoluble Mn(OH)2 forms