Latimer diagram:
Latimer or reduction potential diagrams show the standard reduction potentials connecting various oxidation states of an element. The Latimer diagram for a series of manganese species in acidic solution is shown below.
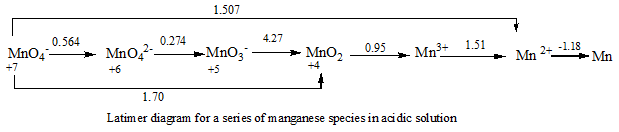
Utility of the diagram: The standard reduction potential for the reduction half-reaction involving the two species joined by the arrow is shown above the arrow. Latimer diagrams show the redox information about a series of species in a very condensed form. From these diagrams you can predict the redox behaviour of a given species. The more positive the standard reduction potential, the more readily the species on the left is reduced to the species on the right side of the arrow. Thus, highly positive standard reduction potentials indicate that the species at the left is a good oxidizing agent. Negative standard reduction potentials indicate that the species to the right behaves as a reducing agent.
Construction: In a Latimer diagram of an element, oxidation numbers of the element decrease from left to right and the numerical values of E° in volts) are written above the line joining the species involved in the couple.
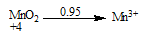
In the above example, the notation denotes the half-cell reaction with E° = +0.95 volt

Note that both of these half-reactions involve hydrogen ions, and therefore the potentials depend on pH.
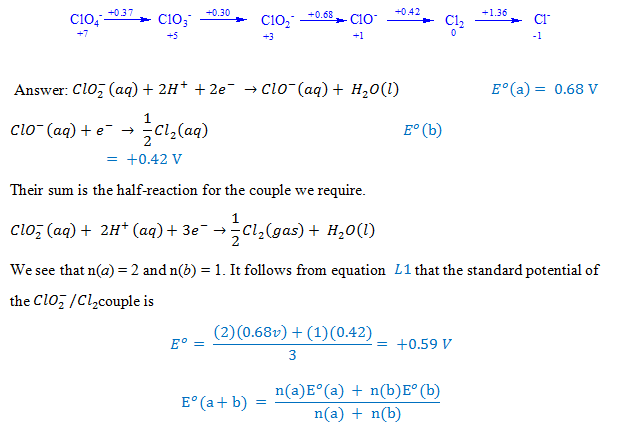
e . g . The Latimer diagram for chlorine in acidic solution, for instance, is

In basic aqueous solution, the Latimer diagram for chlorine is

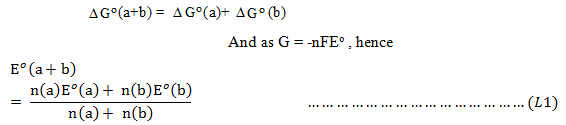
Nonadjacent species: For the nonadjacent species the standard potential of a couple that is the combination of two other couples is obtained by combining the standard Gibbs energies, not the standard potentials, of the half-reactions.
Q. From the Latimer diagram for chlorine in basic aqueous solution find out the reduction potential value for ClO2−/Cl2 couple.