IV.5 Stability of feedback control system
Frequency response analysis is an useful tool for designing feedback controllers. It enables the designer to study the stability characteristics of a closed loop system using Bode or Nyquist plots and also to select the appropriate design values of controller parameters.
IV.5.1 Bode Diagram of closed loop process
IV.5.1.1: Bode diagram of PID controler
It is also worth to study the Bode diagram of PID controller in the following figure.
|
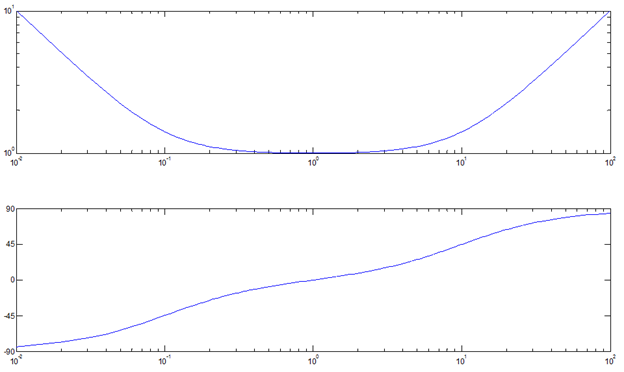 Fig. IV.13(a): Bode Diagram of PID controller
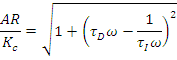
 The PID controllers have the following characteristics:
 |
|
And
|
It is left to the reader to exercise how to arrive at above eqs. Note that the PID controllers ideally have three asymptotes.
• At ![]() with a slope
with a slope ![]()
• At ![]() with a slope
with a slope ![]()
• At ![]() with a zero slope.
with a zero slope.
IV.5.1.2: Bode diagram of Processes in series
Let us have a control loop with two components, viz ., one PI controller and one first order plus dead time model.
|
The open loop transfer function is
|
The above open loop transfer function is a combination of four individual processes in series, viz., pure gain, pure dead time, first order system and PI controller. Two time constants are observed in the series that would yield the location of corner frequencies viz ., ![]() or
or ![]()
|
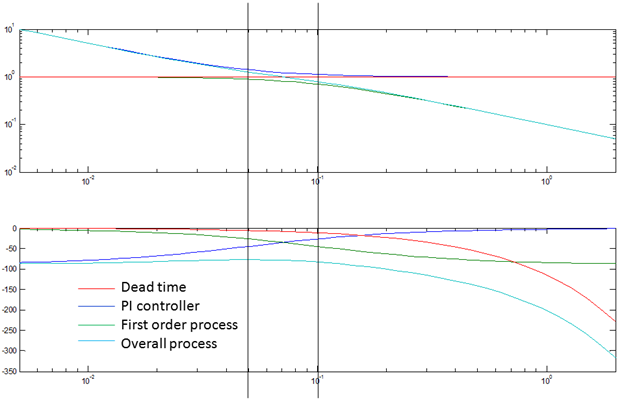 Fig. IV.13(b): Bode plot of processes in series given in example
 The above figure shows the Bode plot of the open loop process indicated in this example. AR and phase shift for all individual transfer functions as well as the overall transfer function have been indicated along with the location of corner frequencies.