6.2 Boiling of saturated liquid
In this section, we will discuss about the boiling curve which is a log-log plot between heat flux (q/A) or heat transfer coefficient (h) and excess temperature (ΔT). Excess temperature (ΔT = Tw - Tsat) is the temperature difference between heating surface (Tw) and saturated temperature of the liquid (Tsat).
Figure 6.2 shows a typical representative pool boiling curves for water contained in a container where the water is heated by an immersed horizontal wire. Consider we are measuring the heat flux (thus, h) and the temperature difference (ΔT) between the boiling water (Tsat) and the wall temperature of the heater wire (Tw). The temperature of the heater wire is gradually raised while measuring the heat flux between heated surface and boiling water until a large value of ΔT reaches. The corresponding plot is prepared at the log-log scale. The plot shows six different sections in the boiling curve shown in the fig.6.2.
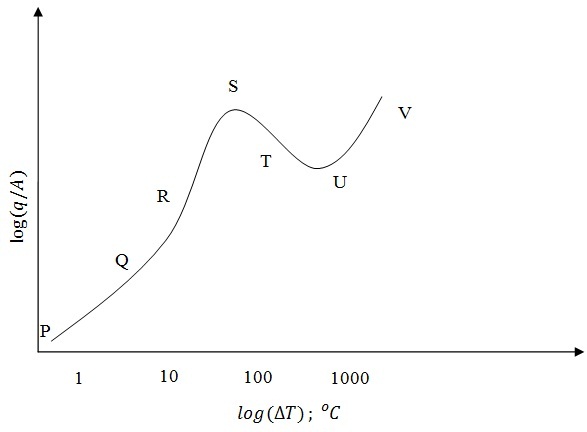
Fig. 6.2: Saturated water boiling curve
The different regimes of the boiling plot (fig. 6.2) have different mechanism. We will see those mechanisms in-brief in the following section.