Table 23.2: Analysis of the chromatograms |
|
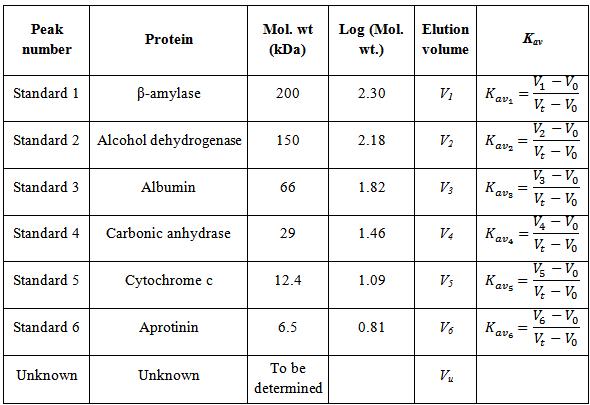
- 27. Plot the Kav values against the log10 (Mol. wt.) for the reference proteins to obtain the standard curve.
28. Fit the data using linear regression (Note 5).
29. Determine the log10 (Mol. wt.) for the unknown protein using the regression line equation.
30. Take antilog of the log10 (Mol. wt.) to determine the molecular weight.
Notes:
- 1. The standards for molecular weight determination should be of the same shape as the molecule whose molecular weight is to be determined i.e. globular proteins for a globular protein under question, fibrous proteins for a fibrous protein under question, peptides for a peptide under question. In case such standards are not available, other suitable reference molecules can be used. The standard proteins used in this experiment are well established markers for gel filtration and are commercially available.
2. The column matrix and the proteins for the standard plot are chosen based on some idea about the molecular weight of the unknown protein. If there is no such information available, Sephacryl HR, the matrix with fractionation range of 40 – 20,000 kDa, can be used.
3. Each of the standard proteins used in this experiment has either tyrosine or tryptophan or both and can therefore be monitored through absorbance at 280 nm.
4. The absorbance of a protein at 280 nm is the outcome of the light absorbed largely by tryptophan and tyrosine residues and by disulfide linkages to a small extent. If the unknown protein lacks these chromophores, the protein will not absorb the 280 nm light. It is therefore important to record an absorption spectrum of the unknown protein from 210 – 300 nm. If the spectrum lacks an absorption band ~ 280 nm, the absorbance of the protein fractions should be recorded at 214 nm for plotting the chromatogram.
5. Molecules of similar shapes and densities display sigmoidal relationship between their Kav values and the log10 (Mol. wt.). Over a considerable Kav range (~0.1 – 0.7), however, the relationship is linear.