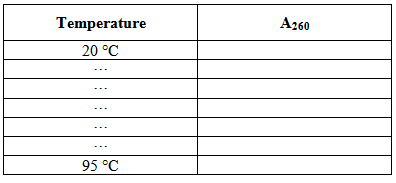
Observation table:
Table 7.1 Observation table for DNA melting curve |
Analysis:
- 1. Plot the A260 against the temperature.
2. Determine the mid-point of the curve i.e. ![]() , where
, where ![]() is the maximum change in absorbance during thermal denaturation.
is the maximum change in absorbance during thermal denaturation.
3. The temperature corresponding to ![]() is the melting temperature.
is the melting temperature.
Notes:
- 1. The cuvettes need to be covered with the PTFE lids while making measurements to avoid any evaporation. The temperature sensor that is used in the Peltier equipped spectrophotometer should fit in the PTFE lids.
2. In the methods described above, temperature steps of 5°C have been used. In case it is difficult to accurately determine the melting temperature, smaller temperature steps can be used near the Tm.