The focused beam of electrons is then scanned across the surface in a raster fashion (Figure 18.2). This scanning is achieved by moving the electron beam across the specimen surface by using deflection/scanning coils. The number of secondary electrons produced by the specimen at each scanned point are plotted to give a two dimensional image.
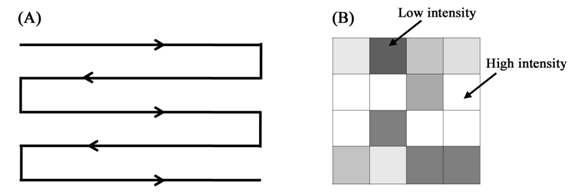
Figure 18.2 A diagrammatic representation of the raster scanning (A) and the intensity plot for the scanned area (B).
In principle, any of the signals generated at the specimen surface can be detected. Most electron microscopes have the detectors for the secondary electrons and the backscattered electrons. Figure 18.3 shows the interaction volume within the specimen showing the regions of secondary electrons (energy < 50 eV) and backscattered electrons.
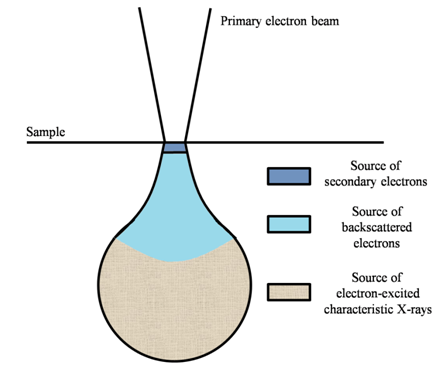
Figure 18.3 Specimen-electron interaction volume within the specimen. Notice the different regions where secondary electrons and backscattered electrons come from.