As is clear from the definition of absorbance and transmittance, both are dimensionless quantities. Absorbance and transmittance are therefore represented in arbitrary units (AU). The quantity of interest in an absorption spectrum is the molar absorption coefficient, ε which varies with wavelength (Figure 4.5). The wavelength at which highest molar absorption coefficient (εmax) is observed is represented as λmax. Area of cross-section of the absorbing species puts an upper limit to the molar absorption coefficient.
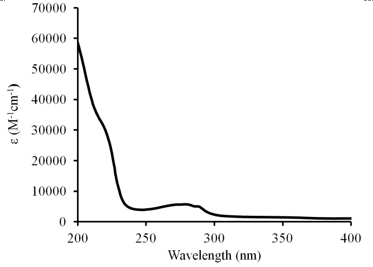
Figure 4.5 An absorption spectrum of N-acetyl-tryptophanamide
Deviations from Beer-Lambert law:
Beer-Lambert law can be used to determine the ε values of a compound by recording its absorption spectra at known concentrations. Alternatively, knowledge of ε enables the user to calculate the concentration of a compound in a given solution. It is, however, not uncommon to observe deviations from the Beer-Lambert law. Three major reasons that are responsible for the breakdown of linear relationship between absorbance and the concentration of the absorbing molecule are:
- High sample concentration: The Beer-Lambert law generally holds good only for dilute solutions. At higher concentrations, the molecules come in close proximity thereby influencing their electronic properties. Although introduced as a constant at a particular wavelength for a compound, ε depends on the concentration of the compound and therefore results in deviation from linearity. At lower concentrations, however, ε can practically be assumed to be a constant.
- Chemical reactions: If a molecule undergoes a chemical reaction and the spectroscopic properties of the reacted and unreacted molecules differ, a deviation from Beer-Lambert law is observed. Change in the color of the pH indicator dyes is a classical example of this phenomenon.
- Instrumental factors: As ε is a function of wavelength, Beer-Lambert law holds good only for monochromatic light. Use of polychromatic radiation will result in deviation for linearity between absorbance and concentration.
For practical purposes, the samples giving absorbance values between 0.05 – 0.5 are considered highly reliable. At lower concentrations , the signal to noise ratio is small while at higher concentrations, absorbance values underestimate the concentration of the compound as increase in absorbance no longer matches the increase in concentration. If the absorbance values are higher, a sample can be diluted or a sample cell with smaller path length can be used; usually dilution of sample is preferred.
In the following lecture, we shall discuss the various factors that influence the absorption spectra of molecules and look at the applications of UV/Visible absorption spectroscopy for studying the biomolecules.