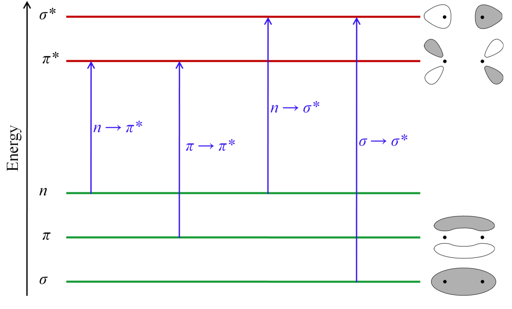
Figure 4.2 Schematic diagram showing energy levels of different orbitals and possible absorption transitions
As shown in figure 4.2, σ → σ* transition is a high energy process and therefore lies in the vacuum UV region. Alkanes, wherein only σ → σ* transition is possible show absorption bands ~150 nm wavelength. Alkenes have π and π* orbitals and can show several transition; the lowest-energy transition, π → π* gives an absorption band ~170-190 nm for non-conjugated alkenes (effects of conjugation on electronic transitions are discussed later). The presence of nonbonding electrons in a molecule further expands the number of possible transitions. The entire molecule, however, is not generally involved in the absorption of the radiation in a given wavelength range. In an aliphatic ketone, for example, the absorption band around 185 nm arises due to the π → π* transition in the carbonyl group. Atoms that comprise the molecular orbitals involved in the electronic transitions constitute the molecular moiety that is directly involved in the transition. Such a group of atoms is called a chromophore. A structural modification in a chromophore is generally accompanied by changes in the absorption properties.