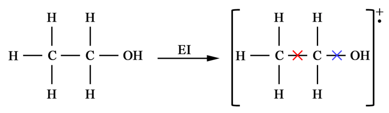
The cross signs in the molecular radical cation represent the cleavage sites of the molecular ion. Cleavage between methyl and methylene carbons (red cross) can result in [CH3]+ or [CH2OH]+ ions while cleavage between methylene carbon and oxygen can result in [C2H5]+ or [OH]+ ions. The electron ionization mass spectrum for ethanol will therefore look like as shown in Figure 13.2. The idea behind identifying the structure of the molecules is to look at the differences between the peaks. A difference of 15 Da will be due to methyl loss, a difference of 17 is suggestive of the hydroxyl group, a difference of 29 can be due to the loss of an ethyl or aldehyde group. This information can be used to identify the molecules. In fact, there are softwares available which can provide the possible molecular formulae of the compound when fed with the MS peaks.

Figure 13.2 Electron ionization mass spectrum of ethanol
Analysis of biomolecules
Since the advent of MALDI and ESI ionization method, mass spectrometry has become a routine method for analyzing biomolecules. MS has been successfully utilized for obtaining a large amount of information about biomolecules including information that is difficult to obtain using other tools. Let us go through the various applications of MS in biomolecular analysis:
Molecular weight determination: Determination of molecular weight of a biomolecule is the most straightforward application of MS.