Consider the function

Since,  for every for every  , the graph of the function lies above the , the graph of the function lies above the  -axis. -axis.
Further,
 and and  , for all , for all  . .
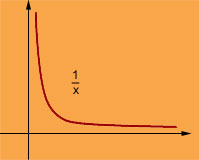
Thus,  is a strictly decreasing, concave up function. Thus, it is natural to ask, what does the graph look like for all large values of is a strictly decreasing, concave up function. Thus, it is natural to ask, what does the graph look like for all large values of  , and for all small values of , and for all small values of  ? We note that ? We note that
 and and  . .
We can interpret these as follows: as  increases to increases to  , ,  comes closer and closer to comes closer and closer to  -axis, the line -axis, the line  , and as , and as  decreases to 0, decreases to 0,  comes closer and closer to comes closer and closer to  -axis, the line -axis, the line  . Thus the graph of . Thus the graph of  is as follows: is as follows: |