| |
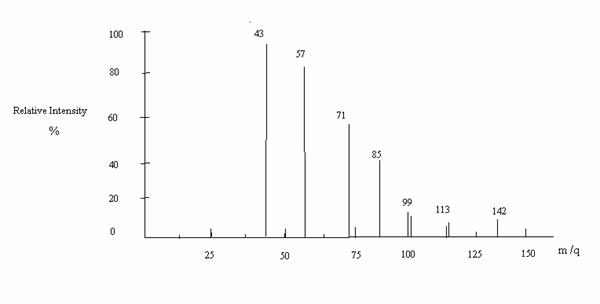
We will consider a couple of examples of mass spectra. Mass spectrum of methane is expected to give peaks corresponding to CH4+, CH3+,CH2+ and CH+. All peaks do not have equal intensities. The stablest ion has the largest intensity and for comparison with other peaks, this intensity is set to 100%. Ethane will show peaks at C2H6+, C2H5+, CH3+ (intense). CCl4 shows corresponding to CCl4+, CCl3+, CCl2+ and CCl+ . The major peaks in the dissociation of n-decane are at 142 (I=0.05), 113 (I=0.05), 99 (I = 0.08) 85 (I = 0.2), 71 (I = 0.35) 57 (I = 0.85), 43 (I = 0.1) and 29 (I = 0.22). Here, I corresponds to the relative intensity. A “fine structure” corresponding to the loss of one or two hydrogen atoms is also observed. A sketch of the mass spectrum is given in Fig. 15.11. |
| |
Figure 15.11. A sketch of the Mass Spectrum of n-C10 H22 |
| |
The peak at 142 corresponds to C10 H22+. A loss of C2H5 gives a peak at 113 (C8H17+). Stepwise losses of CH2 (14 atomic mass units, u) groups give peaks at 99, 85, 71, 57, 43 and 29. The last one corresponds to C2H5+. Other peaks at 27, 41, 55, 56, 69, 70, 84, 98 and 112 are also seen (not shown in Fig 15.) The intensity of the peaks is difficult to predict a-priori and these depend on the stabilities of the structures. In the above spectrum, C3H8+ is the most stable and long lived ion. Analysing mass spectra can actually be whole lot of fun.
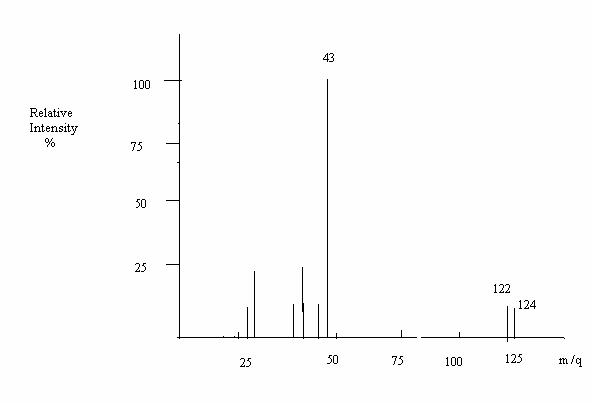
Example 15.2 Rationalize the peak structure of the mass spectrum of CH3 CH2 CH2 Br (1-bromopropane).
Solution. Br has two isotopes of mass 79 and 81 and both have nearly the same abundance. Parent molecular ions are observed at m/q of 122 and 124. The loss of 79Br from the molar mass of 122u gives a base peak at 43 for the ion CH3 CH2 CH2+ . The sketch of the spectrum is shown in Fig 15.12. |
| |
Figure 15.12. A sketch of the mass spectrum of CH3 CH2 CH2 Br . |