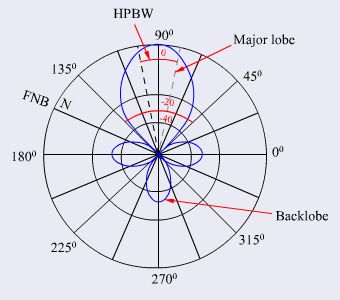
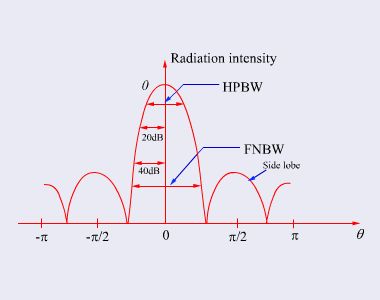
Fig 7.3(a) shows a typical radiation pattern plot in polar coordinates and Fig 7.3(b) shows the same in rectangle coordinates.