
Contents
DETECTION AND ANALYSIS OF SIGNALS
DETECTION:
The signals that we seek may be of two kinds. Either they are intentionally sent out to us by civilizations in an attempt to contact us, or they simply be leaking out of their planets unintentionally.Project Phoenix:
Project Phoenix is the world's most sensitive and comprehensive search for extraterrestrial intelligence. It scans for both kind of signals, ie those deliberately beamed our way, and those that are inadvertently transmitted from another planet. Phoenix began observations in February, 1995 using the Parkes 210 foot radio telescope in New South Wales, Australia. This is the largest radio telescope in the Southern Hemisphere. Phoenix scans the skies around stars that resemble the sun in their size and composition. We expect the probability of finding life around such stars to be comparatively higher. Thus stars surrounded by planets are closely observed in preference to binary star systems. There are about one thousand stars targeted for observation by Project Phoenix. All are within 200 light-years distance.Arecibo Radio Telescope:
It is the largest radio telescope in the world and the is used in the Berkeley SETI search. The large dish reflects and concentrates the weak celestial signals on the receiving antennas hung above. The Observatory operates on a continuous basis, 24 hours a day every day, providing observing time, electronic, computer, travel and logistic support to visiting scientists. The Observatory is located on the Caribbean island of Puerto Rico.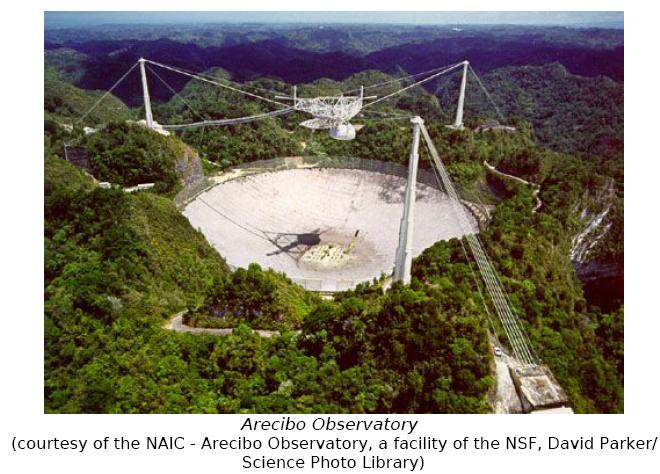
ANALYSIS OF SIGNALS:
The output received from the telescopes is digitized and converted into a baseband signal using various filtering and mixing devices. This digitized signal is subjected to further analysis as described below.De-Chirping:
The relative motion of planets due rotations and revolution introduces Doppler shifts into the signals received. These chirped signals are received by the telescope. Since we are unaware of the rest frame of the transmitting source in the laboratory's topocentric reference frame, softwares are used to examine thousands of different Doppler acceleration frames of rest (dubbed chirp rates), ranging from -10 Hz/sec to +10 Hz/sec.De-chirping the data is accomplished by multiplying the time domain data by the complex vector V:
V = e(-j*c*t2)
where:
t = time
c = chirp rate (ranges from -10 Hz/sec to +10 Hz/sec)
The resulting de-chirped signal is then further analyzed using the discrete flourie r transform(DFT).
Discrete Fourier Transform:
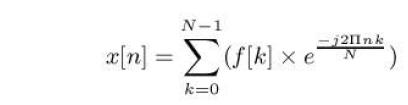
The output signal from the telescope is digitized and we have the sampled signal. We need to analyze the signal in the frequency domain in order to distinguish the signal from noise. In the frequency domain, the analysis is carried out by sampling the signal at various frequency resolutions (bandwidths). The sampling of the signal in the frequency domain is done by taking the Discrete Fourier Transform(DFT).The Discrete Fourier Transform of a discrete periodic signal, x[n] ,with a period N is defined by:
Let x(t) be a signal which is non-zero for t between 0 and T. Let X(f) be its Fourier Transform. Let x[n] be the signal obtained by taking N samples of the signal x(t). We now argue that what we obtain on sampling X(f) with a sampling frequency of 1/T is approximately the DFT of the periodic extension of x[n] with a period N.
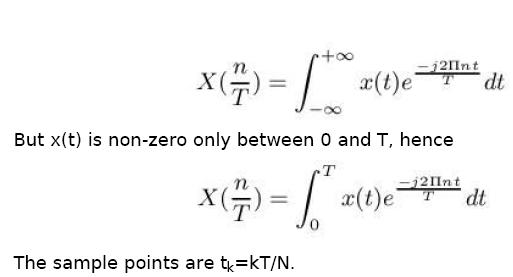
Now approximating the signal with the left end point Riemann summation we get:
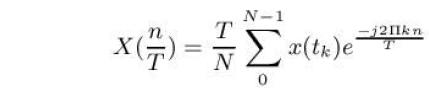
Thus we see that X(n/T)=T/N *X[n]
Hence we use DFT to analyze the signal in the frequency domain at different frequency resolutions.
In practice,however we use software to determine the DFT of a signal. It requires a lot of calculations to determine the DFT of a signal. In order to increase the efficiency we determine the Fast Fourier Transform(FFT) instead of DFT. It serves the same purpose as that of the DFT and can also determined with fewer calculations. The FFT is carried out on the sample at different frequency resolutions. The finest frequency resolution is 0.07Hz. This means that T=1/0.075 =13.375 seconds. The output from the telescope is a 107 second data. Hence it is divided in to 8 chunks of 13.375 seconds each. Now FFT is carried out on each of the 8 chunks of data. Then the FFT is carried out at 0.15 Hz. For this resolution T=1/0.15=6.7 seconds. Thus the data is divided into 16 chunks each of 6.7 seconds and 16 FFTs are determined. This process is carried out for 15 frequency resolutions fn=0.075 * 2n Hz, n = 0, ... , 14 and FFTs are determined in each of these cases. Finally the signals that show a strong power which increases and then decreases over the 12 second period can be tentatively considered extraterrestrial in nature.
For each of the above frequency resolutions and chirp rates we analyze the signal for the following four types of signals:
1. Spikes: Spikes are radio waves occurring at single frequencies that are strong enough to be distinguished from general noise. The data is examined for signals whose power exceeds 22 times the mean noise power.
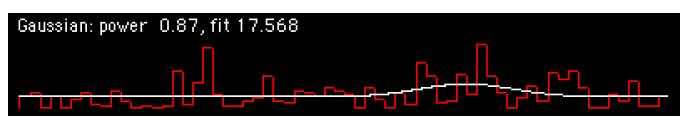
2. Gaussian: Gaussians are signals whose power goes up an down as the telescope moves across the sky. As a radio source drifts through the field of view of the telescope, the measured power will vary depending on the telescope's beam profile, which is approximately Gaussian. A beam fitting algorithm is used to fit a Gaussian curve at each time and frequency of the form:
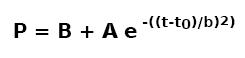
where
P = predicted power
B = baseline power
A = peak power
t = time
t0 = time of Gaussian peak
b = half power beamwidth
The parameters B, A, and t0 are unknown, but the beamwidth is known. It can be calculated from the slew rate of the telescope beam.
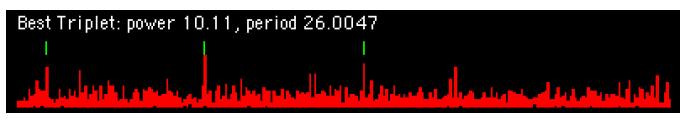
3. Triplet:We assumed that the aliens would send pulsed signals in an attempt to contact us. So we analyze the data for the presence of pulsed signals. A triplet is a type of pulsed signal. In order to determine the presence of triplet signals we look for pulses above a certain threshold value for every frequency slice in the spectrum. A reasonable value of the threshold frequency is chosen so that a reasonable number of pulses are revealed, yet we are not overwhelmed by the noise which leads to a number of useless calculations. For every pair of pulses above the threshold, the we look for a pulse exactly in between the two. The algorithm used for doing this avoids any sort of repetition in trying all pairs. This process is repeated for every frequency slice.
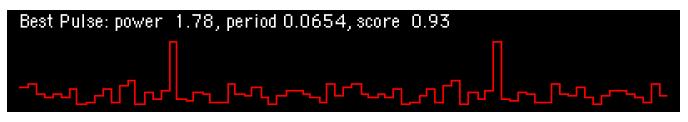
4. Pulse: Pulses are signals which seem to repeat themselves at constant intervals. An algorithm called fast folding algorithm is used to determine the pulses. This analysis is carried out in every frequency slice of the 10Hz data. We try to detect many small repeating pulses in the data. Quite often these small pulses so weak that get lost in the noise and are undetectable. We select a frequency slice from the data and examine the power vs time data for the pulses. The data is divided into uniform sized time chunks and these chunks are added together. If the size of the time chunk is the same as (or a multiple of) the period of the pulses, all the pulses will add one on top of the other and we will see the pulses grow out of the noise. As we have no idea about the frequency of the pulses, we have to try all the time periods. Again, the algorithm does this in such a way that it will not repeat work already done.