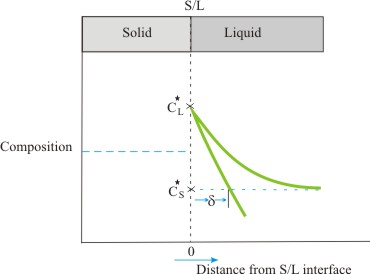
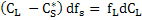
At the onset of solidification  and and 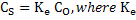 is the partition coefficient, which is shown in the figure 31.2 at X=0. As the solidification proceeds the composition of liquid follows the liquidus line (see figure 31.1) but there will be gradient of solute since no mixing is assumed in solid. Figure 31.2 shows the variation of concentration of solute in the solid by a green line. In the figure is the partition coefficient, which is shown in the figure 31.2 at X=0. As the solidification proceeds the composition of liquid follows the liquidus line (see figure 31.1) but there will be gradient of solute since no mixing is assumed in solid. Figure 31.2 shows the variation of concentration of solute in the solid by a green line. In the figure  is the interfacial concentration. As the solidification proceeds more and more solute will be rejected in the liquid but no gradient of the solute will be built-up in the liquid since complete mixing is assumed. Mass balance of solute when a small amount of solid is the interfacial concentration. As the solidification proceeds more and more solute will be rejected in the liquid but no gradient of the solute will be built-up in the liquid since complete mixing is assumed. Mass balance of solute when a small amount of solid  forms and causes solute to increase in liquid dCL forms and causes solute to increase in liquid dCL
 |
(1) |
 and and  |
(2) |
By 1 and 2 and integrating the equate on 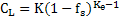 |
(3) |
 |
(4) |
Equation 4 is Sheil’s equation.  is segregation coefficient. The role of partition coefficient of an element on solidification becomes clear from equation 4. At Ke = 1, is segregation coefficient. The role of partition coefficient of an element on solidification becomes clear from equation 4. At Ke = 1,  = 1 for all values of fS. However, when Ke is < 1, > 1for all values of fs. The value of is given for some elements in iron in table. = 1 for all values of fS. However, when Ke is < 1, > 1for all values of fs. The value of is given for some elements in iron in table.
Element |
 -iron -iron |
 - iron - iron |
C |
0.13 |
0.36 |
S |
0.02 |
0.02 |
P |
0.13 |
0.06 |
O |
0.02 |
0.02 |
N |
0.28 |
0.54 |
H |
0.32 |
0.45 |
Mn |
0.84 |
0.95 |
Ti |
0.14 |
0.07 |
|
A more practical situation for solidification would be no mixing in either solid or in liquid. As the solid/liquid interface advances into the liquid, solute concentration builds up near the interface since no mixing in the liquid is assumed. There will be gradient of concentration in the liquid as illustrated in the figure 31.3.
| Figure 31.3: |
Concentration versus distance profile. In the figure  is boundary layer thickness in which gradient of concentration persists is boundary layer thickness in which gradient of concentration persists |
|