Equilibrium solidification
Equilibrium solidification of an alloy of any composition occurs when concentration of the liquid and that of solid follows the liquidus and solidus line of the phase diagram. Though it is an idealized concept, equilibrium solidification helps understanding the compositional changes that occur during solidification. Solidification of an alloy of a composition begins when the temperature reaches to the liquidus line. Lowering of temperature changes the composition of elements both in liquid and solid phase. Composition of liquid and solid in the two phase region at any temperature is determined by a tie line. The tie line connects liquidus and solidus line at a temperature in the two phase region.
As equilibrium is assumed, at some temperature between  (liquiudus temperature) and (liquiudus temperature) and  (solidus temperature) (solidus temperature)
 . .
according to lever rule  and and  are liquid and solid fraction respectively. are liquid and solid fraction respectively.
Non equilibrium solidification
Assumption of complete mixing does not prevail in actual solidification process. Diffusion in the solid is a slow process. Fluid flow in liquid will govern the concentration gradient of the solute in the liquid. Only faster mixing can minimize the concentration gradients, otherwise concentration gradients will be present in the liquid also. The presence of gradients in the solid and liquid during solidification makes the solidification process to deviate from the equilibrium. This means that in the actual solidification of alloy the concentration of solute in the liquid and solid rarely follows the liquidus and solidus lines of the respective phase diagram
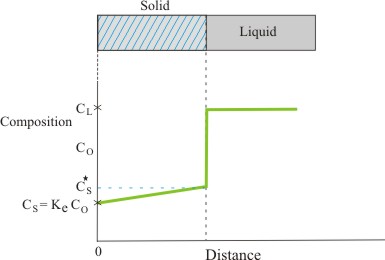
Consider solidification of an alloy of composition Co at temperature T (see figure 31.1) in which there is no mixing in the solid but mixing in liquid is sufficiently large so as to have no composition gradient in the liquid. In other words liquid has a uniform composition at every stage of solidification. This can be illustrated by plotting concentration of solute Vs distance both in the solid and liquid as shown in figure 31.2
| Figure 31,2: |
Concentration vs. distance profile in solid and liquid in one dimensional solidification |
|