5.3.5 Case I: Second order Transition
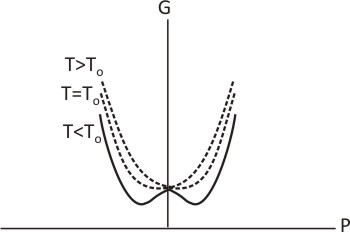
When b is positive, the ferroelectric transition occurs at a temperature T = T0 and is called as second order transition (do not get confused between T0 and Tc as the distiction will become clear in the next section when we learn first order phase transition). Under such a situation, free energy as function of polarization evolves continuously when temperature is changes i.e. from a curve with single minima at P = 0 when T < T0 to a plot with two minima at P = +P0 and –P0 when T > T0. Two curves become closely related if ‘a’ changes continuously with temperature and changes sign at Tc and can be shown together as in figure 5.7 (a) below.
| Figure 5.7 Effect of temperature on the free energy vs polarization plot. Note how the sign of a changes with temperature and its effect on the curve. |
The spontaneous polarization, P0, can be estimated by substituting E = 0 in equation (5.20) and retaining only two lowest order terms since all the coefficients i.e. a0, b and c are positive. The polarization can be expressed as
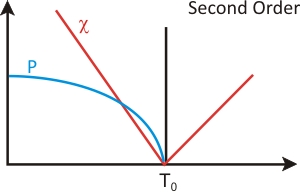
showing that the polarization decreased to zero at T = T0 as shown in figure 5.8.
Dielectric susceptibility at T < T0 can be estimated as
Showing that susceptibility will have a divergence at T = T0 or its reciprocal (i.e. dielectric stiffness) will vanish at T = T0 as shown in figure 5.8. In real materials, susceptibility reaches very large values near T0.
| Figure 5.8 Effect of temperature on polarization and reciprocal susceptibility for a second order phase transformation. |
This transition is also depicted by a discontinuity in specific heat at transition which is estimated by using P = 0 at T > T0 while using value given by (5.15) for T < T0.
Now substituting  in (5.23) yields in (5.23) yields
Examples of ferroelectric materials showing a second order transition are materials like Rochelle salt and KH2PO4.
|