Voltage response in piezoelectric patch for Configuration 1
Voltage response for healthy laminate is shown in Figure 25.2.
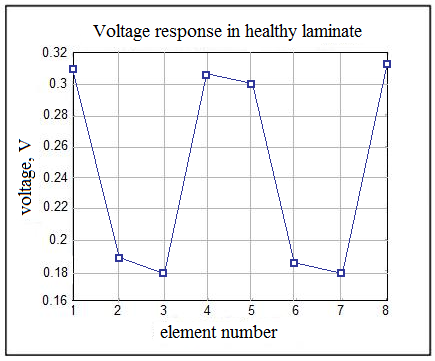
Figure 25.2 Voltage profile in the healthy laminate for Configuration (1)
Figures 25.3(a) to (f) represent the voltage signals obtained in all the 8 elements of Configuration 1. The voltage profile in all the elements are predicted by simulating delamination in a particular element at a time. It has been assumed that the shape of delamination is exactly matching with the shape of the element. Since, Configuration 1 has a vertical symmetry along the line dividing the plate in two equal parts; the elements placed symmetrically with respect to one another have similar voltage responses. In case of delamination in a particular element, it is assumed that the stiffness contribution of that element is negligible. This suggests a modified stress distribution in the laminate and loss of symmetry of stress in a lamina prevailing before delamination. In all the figures, voltage response of delaminated composite is compared with the healthy ones.
In the healthy laminate, elements 1, 4, 5 and 8 are subjected to greater stresses due to their location (closer to the centre of the plate) and the voltage responses for healthy laminate for these elements are in the range of 0.30V to 0.31V [Figure 25.2]. Elements 2, 3, 6 and 7 are stressed to a lesser extent and have voltage responses in the range of 0.18V to 0.19V. |