Some LES Results
Figure 35.1 shows the geometry of interest pertaining to our investigation (Cziesla et al., 2001). It consists of a semi-enclosed rectangular slot jet of width B and length Ly . The impingement plate is of length Lx and the distance between the impingement plate and the top wall is h = Lz .
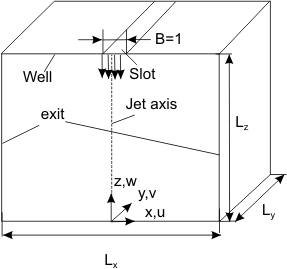
Figure 35.1: Impingling slotjet, geometry and coordinate system
Results indicate that the mean axial velocity on the jet-axis decays linearly with axial distance (35.2). In the present study, the distribution of the normalized jet axial velocity w/w m along x/b w at different distances, ( z ) from the impingement plate has been analyzed. Figure 35.2 shows the self-similar development of the axial velocity between z = 12 and z = 4. The present computation compares reasonably well with the experimentally obtained Gaussian-like curve of Namer and Otugen (1988). The small discrepancy at larger x ( x = 0 being the jet axis) can be attributed to the difference in local ambient conditions between the experiment and the numerical simulation. For this particular case, the axial velocity was averaged over the width of the domain of interest to obtain a two-dimensional field. The height of the computation domain was taken as z = 20 and the Reynolds number was Re = 10000. The variable, b w is the half-width of the jet.
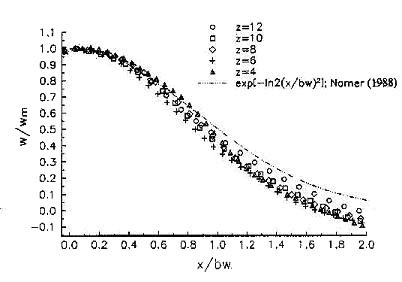
Figure 35.2: Normalized axial velocity distribution of the jet, Re = 100000
The heat transfer results have been compared with the experimental results of Schl ü nder et al. (1970) at Re = 6500. The comparison of span-average Nusselt number distribution has been shown in Figure 35.3. The comparison shows a reasonably good agreement, especially at the stagnation point.
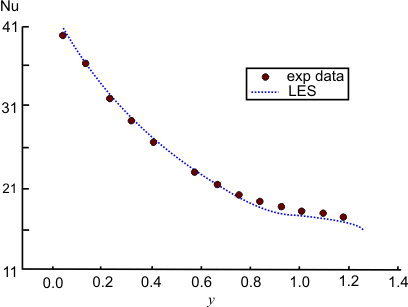
Figure 35.3: Comparison of numerical results with experiment of Schlünder et al. (1970).
The numerical study has been extended to analyze the turbulent flow field and heat transfer in an array of slot jets impinging on a moving surface (Chattopadhyay et al., 2002). The surface velocity, directed perpendicular to the jet, was varied up to two times the jet velocity at the nozzle exit. The Nusselt number distributions for various surface velocities are presented. It has been observed that on one hand increasing velocity of the impingement plate reduces heat transfer, while on the other hand distribution of Nusselt number over the impingement surface becomes more uniform with the increased surface velocity.
Table 35.1 summarizes the results of the time-averaged global Nusselt numbers over the range of surface velocities and Reynolds numbers of interest. Global Nusselt number (average value over the impingement surface) in the Reynolds number range of 500 to 3000 for surface velocities of 0.l, 0.5, 1.0 and 2.0 are presented here. The bracketed figure indicates percentage reduction in Nuav due to various surface velocities as compared with the case of the stationary surface.
Re |
Nuav
|
|
νs = 0.0
|
vs = 0.1 |
vs = 0.5 |
vs =1.0 |
vs = 2.0 |
500 |
9.08 |
9.02 (1) |
8.71 (4.1) |
7.41 (18.4) |
5.82 (36) |
1000 |
13.34 |
13.16 (1.3) |
12.66 (5) |
10.67 (20) |
8.48 (36.4) |
1500 |
17.29 |
17.12 (1.3) |
16.03 (7.2) |
12.77 (26.1) |
10.55 (38.9) |
3000 |
25.90 |
25.53 (1.4) |
23.07 (10.9) |
17.8 (31.2) |
14.67 (43.4) |
Table 35.1: Time-averaged global Nusselt number
|