| |
Data analysis
The color schlieren images are representative of cross-sectional distribution of refractive index gradient of the medium integrated along the
passage of light. They can be processed to obtain both thermal and concentration field information.
These images carry information related to the first derivative of the refractive index. Since refractive
index of a transparent material is related to its density and, in turn, temperature and concentration,
thermal and solutal gradients are mapped by the schlieren technique. For quantitative processing of
schlieren images, the path of a light beam in a medium whose index of refraction is a function of
position is analyzed. The outline of the data analysis procedure is described in the following paragraph
During a color schlieren experiment, the base image namely the filter itself without the test
section in place is initially recorded. Subsequently, test images are recorded by introducing the test cell
with the appropriate heat and mass transfer processes in progress. These images are subsequently
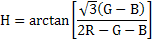
converted into a matrix of R, G, and B values. From the RGB values, the hue (H) function is
evaluated using the formula.
|