A comparison of shadowgraph images over a range of high Rayleigh numbers in water is shown in Figure 5.24. The light intensity variation shows the flow evolving from a boundary-layer type behavior at the lowest Rayleigh number towards large scale structures (namely, plumes) at the highest Rayleigh number. Beyond Ra = 5×10⁶ the flow is unsteady as well. The images shown in Figure 5.24 have been time-averaged over a few seconds so that the dominant spatial features are captured.
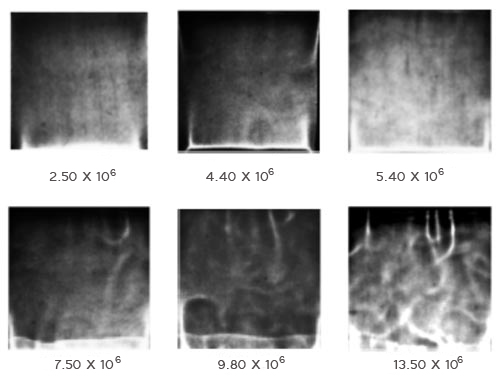
Figure 5.24: Shadowgraph images of the convective field with increasing Rayleigh number in water.
|