| |
Thermal imaging of the test cell filled with water is reported in the following discussion. The vast difference in the properties of air and water leads to certain difficulties in temperature measurement in a water-filled cavity. Specifically, the following issues are to be noted:
- Even for modest temperature differences, the equivalent Rayleigh numbers are very high. Consequently, the convective field reaches the unsteady, turbulent regime quite early.
- The temperature drop per fringe shift is small in water. Thus the fringe density in interferograms is high, making data analysis difficult.
- The sensitivity of the refractive index to temperature is high. Thus the deformation of the cavity size as seen on the screen is large and leads to ambiguity in data analysis.
In view of these complications, it is natural that shadowgraph should be best suited for temperature measurement in water. A comparison of interferometry, schlieren and shadowgraph for a temperature difference of 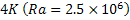 is presented in Figure 5.23. The optical images contain information that is path-integrated in the direction of propagation of light, but are functions of time. Figure 5.23 shows that the shadowgraph has the most well-defined intensity variation and is the easiest to analyze for the present experiment. is presented in Figure 5.23. The optical images contain information that is path-integrated in the direction of propagation of light, but are functions of time. Figure 5.23 shows that the shadowgraph has the most well-defined intensity variation and is the easiest to analyze for the present experiment.
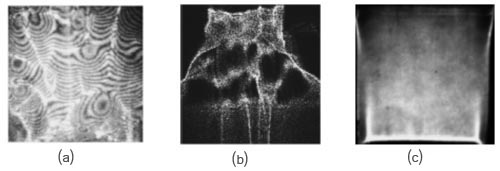
Figure 5.23: Comparsion of (a) interferogram, (b) schlieren and (c) shadowgraph for buoyant convection in a water-filled cavity at 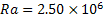
|