| |
Low Rayleigh numbers
Figure 5.10 shows the steady state interferometric and schlieren images for the lower range of Rayleigh numbers namely  . At . At  the interferogram has only a few fringes. The number of fringes in the experiments was uniformly found to be consistent with the estimate the interferogram has only a few fringes. The number of fringes in the experiments was uniformly found to be consistent with the estimate  the denominator being given by Equation 1 (Lecture 29). The number of fringes increases with Rayleigh number, along with the fringe density near the horizontal walls. With respect to the schlieren images, it can be seen that the increase in light intensity is distributed over the cavity cross-section at the lowest Rayleigh number. As Rayleigh number increases, the brightness is limited to the wall region, and its size progressively diminishes. The schlieren image clearly brings out a boundary-layer type of flow structure in the cavity. The above experiments have been validated against a numerical model and the comparison has been found to be good. the denominator being given by Equation 1 (Lecture 29). The number of fringes increases with Rayleigh number, along with the fringe density near the horizontal walls. With respect to the schlieren images, it can be seen that the increase in light intensity is distributed over the cavity cross-section at the lowest Rayleigh number. As Rayleigh number increases, the brightness is limited to the wall region, and its size progressively diminishes. The schlieren image clearly brings out a boundary-layer type of flow structure in the cavity. The above experiments have been validated against a numerical model and the comparison has been found to be good.
A comparison of the steady dimensionless temperature profiles in the cavity as obtained from interferometry, schlieren, and numerical simulation is presented in Figure 5.21. Temperature profiles at two column locations  have been considered. The comparison has been presented for the three Rayleigh numbers referred in Figure 5.20. The shape of the temperature profile, characteristic of buoyancy-driven convection in a Rayleigh-Benard configuration is reflected in all the three approaches. The slopes of the individual curves near the walls give a measure of the wall heat flux. The comparison between the experiments and simulation is seen to be good. Schlieren measurements compare marginally better with numerical simulation, as against interferometry. This is because in interferograms, information about the thermal field is available only at the fringes. Constructing a complete temperature profile requires interpolation between fringes, and is a source of error. In addition, the number of fringes at low Rayleigh numbers is small. have been considered. The comparison has been presented for the three Rayleigh numbers referred in Figure 5.20. The shape of the temperature profile, characteristic of buoyancy-driven convection in a Rayleigh-Benard configuration is reflected in all the three approaches. The slopes of the individual curves near the walls give a measure of the wall heat flux. The comparison between the experiments and simulation is seen to be good. Schlieren measurements compare marginally better with numerical simulation, as against interferometry. This is because in interferograms, information about the thermal field is available only at the fringes. Constructing a complete temperature profile requires interpolation between fringes, and is a source of error. In addition, the number of fringes at low Rayleigh numbers is small.
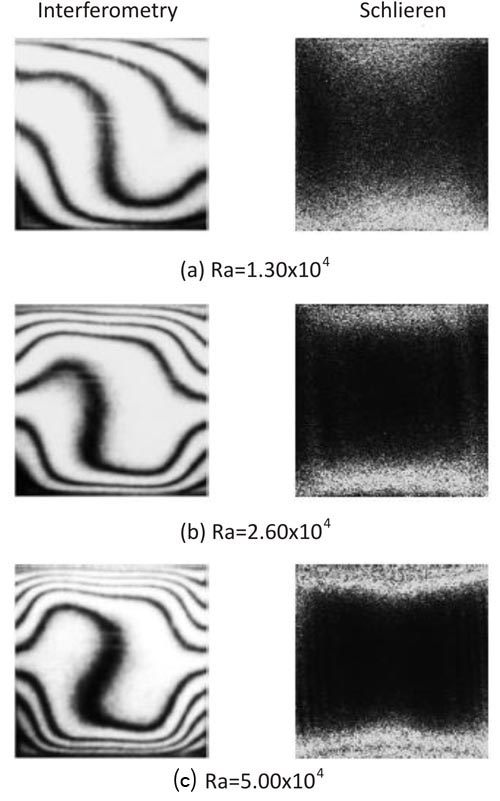
Figure 5.20: Interferometric and schlieren images for the lower range of Rayleigh numbers in air.
|