For a growing KDP crystal, the refractive-index field gradients of the KDP solution and the concentration gradients are related using the following formula:
Here  is the polarizability of the KDP is the polarizability of the KDP  and N is the molar concentration of the solution (moles per 100 gram of the solution). Combining Equations 9 and 15 and integrating from a location in the bulk of the solution (where the gradients are negligible) , the concentration distribution around the growing crystal can be uniquely determined. Equations 13 and 14 show that the schlieren measurements are primamarily based on the original intensity distribution as recorded by the CCD camera. Though the schlieren images shown in the present work for qualitative interpretation of the fluids region have been subjected to image processing operations for contrast enhancement, original images as recorded by the CCD camera are employed for quantitative analysis. Figure 5.5 shows a set of four consecutive schlieren images and their averaged image. The images show a convective plume in the form of high intensity regions above a crystal growing from its aqueous solution and are discussed in detail in the subsequent lectures (27-33). and N is the molar concentration of the solution (moles per 100 gram of the solution). Combining Equations 9 and 15 and integrating from a location in the bulk of the solution (where the gradients are negligible) , the concentration distribution around the growing crystal can be uniquely determined. Equations 13 and 14 show that the schlieren measurements are primamarily based on the original intensity distribution as recorded by the CCD camera. Though the schlieren images shown in the present work for qualitative interpretation of the fluids region have been subjected to image processing operations for contrast enhancement, original images as recorded by the CCD camera are employed for quantitative analysis. Figure 5.5 shows a set of four consecutive schlieren images and their averaged image. The images show a convective plume in the form of high intensity regions above a crystal growing from its aqueous solution and are discussed in detail in the subsequent lectures (27-33).
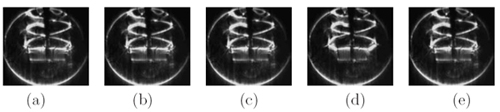
Figure 5.5: Original schlieren images (a-d) of convective field as recorded by the CCD camera and the corresponding time-averaged image(e).
|