If temperature differences within the physical region being studied are large, two factors arise which limit the usefulness of interferometry. These are: (1) the linearity of relationship between density and temperature, and (2) beam deflection due to a refractive index gradient. These factors complicate the data reduction process and make interferometry more of a qualitative tool. However, fringes continue to form and images can be used for flow visualization tool. However, fringes continue to form and images can be used for flow visualization. In the present study, temperature differences between the test section and the ambient are within 20 K and the linear relation between the test section and the temperature has been taken to be valid.
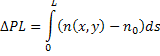
Let 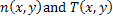 be the refractive index and temperature field respectively, the physical domain being a two-dimensional horizontal plane. A three–dimensional regional can be visualized as a collection of two-dimensional horizontal planes. Let be the refractive index and temperature field respectively, the physical domain being a two-dimensional horizontal plane. A three–dimensional regional can be visualized as a collection of two-dimensional horizontal planes. Let  be the reference values of be the reference values of  respectively as encountered by the reference beam. Let L be the total geometric path length covered individually by the test and reference beams. The interferogram is a fringe pattern arising from the optical path difference respectively as encountered by the reference beam. Let L be the total geometric path length covered individually by the test and reference beams. The interferogram is a fringe pattern arising from the optical path difference
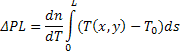
Difference between  and and  occur only over the length of the test cell. Hence L can be taken directly to be the length of the test cell. In terms of temperature, the difference in the path can be expressed as occur only over the length of the test cell. Hence L can be taken directly to be the length of the test cell. In terms of temperature, the difference in the path can be expressed as
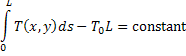
The integral is evaluated along the path of a light ray given by the coordinate s. Neglecting refraction effects, this path will be a straight line and the integral evaluation is greatly simplified. The fringes seen on the interferograms are a locus of points having the same optical path difference. Hence on any fringe the optical path difference  is a constant and is a constant and
Hence,
|