Figure 4.27 shows the reconstructed temperature surface along the central plane for all the three thinning algorithms. These surface show the formation of rolls. The rolls show only a minor variation in the  direction and accordingly, may be classifiled as longitudinal, with the roll axis being parallel to the coordinate. Qualitatively all the three methods display similar results for the temperature field. The formation of longitudinal rolls can be seen with greater clarity with isotherms. The isotherm plots along the midplane of the fluid layer from the automatic thinning algorithm is shown in Figure 4.28. The stretching of isotherms in one direction clearly brings out the orientation of the rolls. direction and accordingly, may be classifiled as longitudinal, with the roll axis being parallel to the coordinate. Qualitatively all the three methods display similar results for the temperature field. The formation of longitudinal rolls can be seen with greater clarity with isotherms. The isotherm plots along the midplane of the fluid layer from the automatic thinning algorithm is shown in Figure 4.28. The stretching of isotherms in one direction clearly brings out the orientation of the rolls.
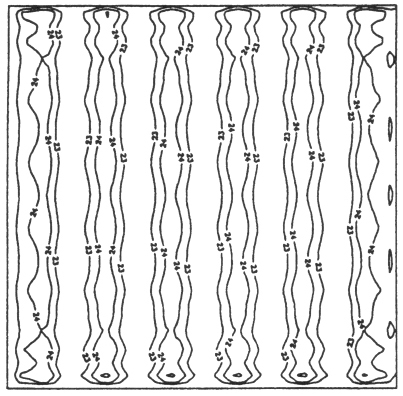
Figure 4.28: Isotherms on the midplane of the fluid layer
|