| |
Uncertainty
The seeding of flow with oil particles, calibration, laser light reflection, background
illumination, image digitization, cross correlation calculation, velocity gradients and out of-
plane particle motion affect the accuracy of PIV measurements. Tracer particles need
to follow the main air flow without any lag. For the particle size utilized and the range
of frequencies in the wake, an expected slip velocity error of  relative to the
instantaneous local velocity is expected. A second source of error in velocity measurement
is due to the weight of the particle. In the present experiments, the effect of the weight of
the seed particles was examined by conducting experiments at a fixed Reynolds number
by varying the size of the cylinder and fixed in flow velocity. The streamline plot and
the dimensionless size of the recirculation region were found to be identical in each
case, and independent of the fluid velocity. The noise due to background light was
minimized by using a band-pass filter (at the wavelength of the laser) before the camera
sensor. The hotwire measurements are affected by the error due to calibration, free
convection effect at small velocity, curve fitting error, electrical noise, digitization error
and turbulence intensity in the incoming fluid stream. The pitot static tube, hotwire anemometry and PIV measurements of mean velocity compared exceedingly well with
each other indicating less than relative to the
instantaneous local velocity is expected. A second source of error in velocity measurement
is due to the weight of the particle. In the present experiments, the effect of the weight of
the seed particles was examined by conducting experiments at a fixed Reynolds number
by varying the size of the cylinder and fixed in flow velocity. The streamline plot and
the dimensionless size of the recirculation region were found to be identical in each
case, and independent of the fluid velocity. The noise due to background light was
minimized by using a band-pass filter (at the wavelength of the laser) before the camera
sensor. The hotwire measurements are affected by the error due to calibration, free
convection effect at small velocity, curve fitting error, electrical noise, digitization error
and turbulence intensity in the incoming fluid stream. The pitot static tube, hotwire anemometry and PIV measurements of mean velocity compared exceedingly well with
each other indicating less than  error in velocity measurements. The drag coefficient
calculation has been carried out at various stream-wise location and found to be within error in velocity measurements. The drag coefficient
calculation has been carried out at various stream-wise location and found to be within
 of each other. From repeated measurements at the zero degree cylinder orientation (Figure 3.35, with Reynolds number kept constant to within of each other. From repeated measurements at the zero degree cylinder orientation (Figure 3.35, with Reynolds number kept constant to within  the uncertainty in
drag coefficient has been determined to be within the uncertainty in
drag coefficient has been determined to be within  . The Strouhal number has
been calculated at different . The Strouhal number has
been calculated at different  and and  locations from both locations from both  and and  -velocity measurements
indicating the uncertainty on Strouhal number to be -velocity measurements
indicating the uncertainty on Strouhal number to be  %. The influence of particle
density on the measured flow field is shown in Figure 3.36; the influence is seen to be
small. %. The influence of particle
density on the measured flow field is shown in Figure 3.36; the influence is seen to be
small.
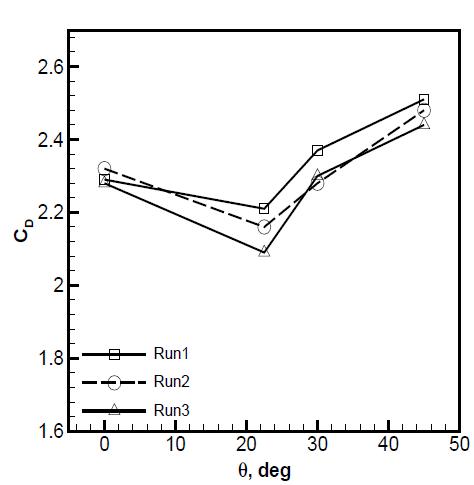
Figure 3.35: Variation of drag coefficient with cylinder orientation. Experiments were
conducted on three different days under nominally similar conditions.
|