Test Cell Flow Quality
The inlet flow turbulence level and the flow parallelism have been tested for flow quality
of the test cell. Figure 3.25 shows representative vector plots at two different velocity
settings from PIV measurements. The turbulence level in the incoming flow is equal to
0.06% (Figure 3.26). The turbulence intensity was measured from the hotwire signal.
The test cell flow parallelism has been presented in Figure 20. Flow parallelism in
the approach flow is better than 98% over 95% of the width of the test cell. Uniform
and stable free stream velocities in the range 0.5-3 m/s were realized in the test cell to
cover the Reynolds number range of 100-800. Figure3.27 (a) also compares the velocity
from pitot static tube with that from PIV. The excellent comparison between the two
techniques indicates successful implementation of the optical imaging procedure.
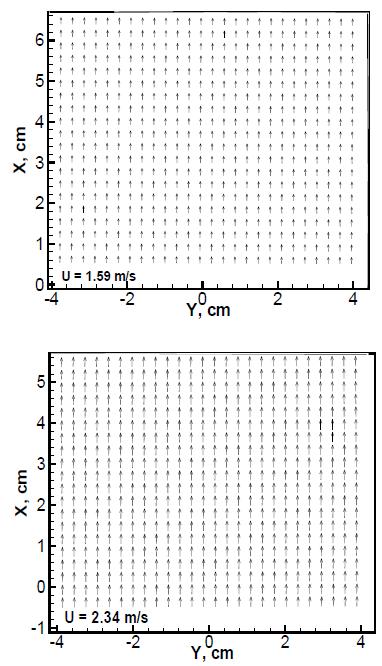
Figure 3.25: Time-averaged free stream velocity vectors from PIV at two blower settings
|