 |
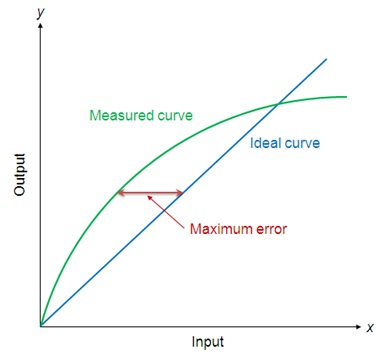
Figure 2.1.1 Non-linearity error |
The nonlinearity indicates the maximum deviation of the actual measured curve of a sensor from the ideal curve. Figure 2.1.1 shows a somewhat exaggerated relationship between the ideal, or least squares fit, line and the actual measured or calibration line. Linearity is often specified in terms of percentage of nonlinearity, which is defined as:
| Nonlinearity (%) = Maximum deviation in input ⁄ Maximum full scale input | (2.1.1) |
The static nonlinearity defined by Equation 2.1.1 is dependent upon environmental factors, including temperature, vibration, acoustic noise level, and humidity. Therefore it is important to know under what conditions the specification is valid.
3.7 Hysteresis
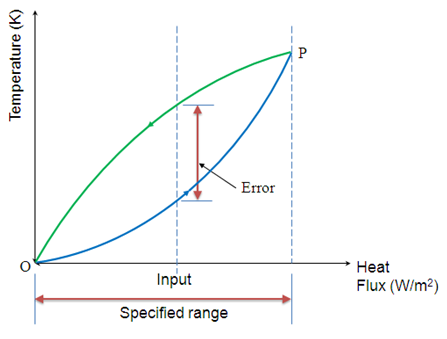 |
Figure 2.1.2 Hysteresis error curve |
The hysteresis is an error of a sensor, which is defined as the maximum difference in output at any measurement value within the sensor's specified range when approaching the point first with increasing and then with decreasing the input parameter. Figure 2.1.2 shows the hysteresis error might have occurred during measurement of temperature using a thermocouple. The hysteresis error value is normally specified as a positive or negative percentage of the specified input range.