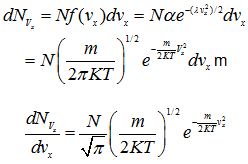
As discussed in the previous lecture, Maxell-Boltzmann velocity distribution function is given by
|
(4.105) |
Variation of dNv/dv with v for three different temperatures T1, T2 and T3 is presented in Fig. 4.14. Area under the dNv/dv versus v represents the total number of molecules. Thus for a system with different temperatures, all the areas will be same.
Consider an elemental strip of thickness dv at a distance v from the origin under the curve for the temperature T1. This elemental strip represents the number of molecules dNv having velocities lying between v and v + dv . Total number of molecules N can be obtained by integrating the from v = 0 to v = ∞. The maxima of these curves (Fig.4.14) fall on an equilateral hyperbola
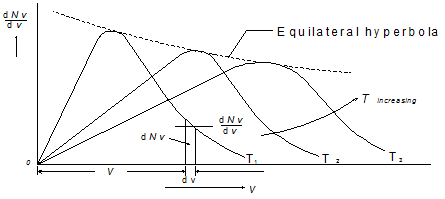
Fig.4.11 Velocity distribution function at different temperature, ![]()
Substituting α and β in ![]() (Eq. 4.91) for ρ, we get
(Eq. 4.91) for ρ, we get
|
(4.106) |
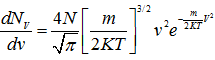
The speed distribution function for each of the three velocity components may similarly be determined. From Eqs. (4.53) and (4.72),
|
(4.107)
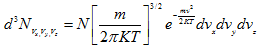
(4.108) |