Contd...
The green arrow depicts the server system or server facility, which has ns number of servers and equals the number of ns customers who are being processed by the respective servers. While on the other hand the red arrow depicted portion signifies the queue system and there are some number of people standing in the queue, which we consider as nq. So in general if we consider the whole system as inside the box, then we have at any point of time (ns + nq) number of people in the system.
We must note that we will always consider the steady state condition, i.e., it is not a death or birth process, hence under this condition we have to define few metric or measure which are important to understand the efficiency of the system, i.e., the system in general. The following are the important measure and they are as given below
 : Expected number of customers in the system : Expected number of customers in the system
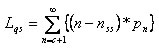 : Expected number of customers in the queue system, and remember here ns is not constant at any given point : Expected number of customers in the queue system, and remember here ns is not constant at any given point
 : Expected waiting time in the system : Expected waiting time in the system
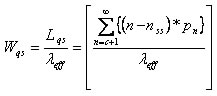 : Expected waiting time in the queue system : Expected waiting time in the queue system
 : Expected number of busy servers : Expected number of busy servers
Without being repetitive we would still like to mention that the system consists of the queue and the server facility combined together and this is an important which has to be noted by the reader. Moreover

is the effective arrival rate such that all the customers coming can join the queue. In case if the rate of arrival of customers is such that some customers cannot join and have to leave then  , else if , else if
 would have no impact on any of the customers coming as they can come and immediately join the queue. would have no impact on any of the customers coming as they can come and immediately join the queue.
One can easily make out the relationship between  and and  , which is , which is  , which is obtained from the fact that , which is obtained from the fact that
 , thus we will also have , thus we will also have 
|