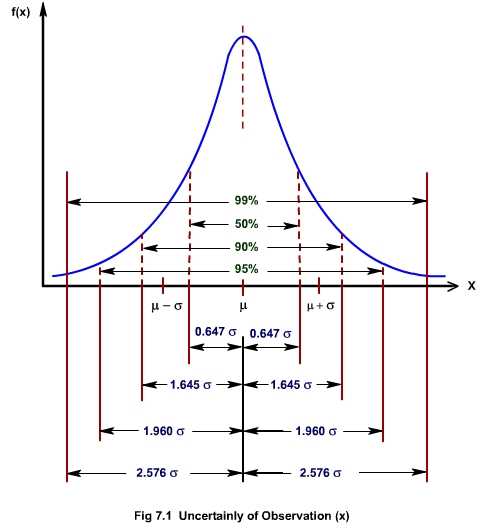
An indicator to define the reliability, of any observation in a set of repeated observations. Figure 7.1 represents the uncertainty involved in an observation. For example, if an observation falls within (m ± s) [where m represents the mean and s the standard deviation of the set of the observations] then the observation lies within 68.3% errors of the set of observation. Thus, 68.3% is designated as the uncertainty of the sample.
To ascertain the reliability of an observation, it is required to find within what percentage of error a particular observation lies. This defines the uncertainty of the observation and consequently its reliability. Lower the percentage of error within which a particular observation lies, lower is its uncertainty and thus greater is its reliability.
For example, an observation is 50% uncertain if it lies within m - 0.6745 s and m + 0.6745 s; 90% uncertain if lies in m -1.645 s and m + 1.645 s; 95% uncertain if it is within m - 1.960 s and m + 1.960 s and 99% uncertain for observation lying within m - 2.576 s and m + 2.576 s, (Figure 7.1).