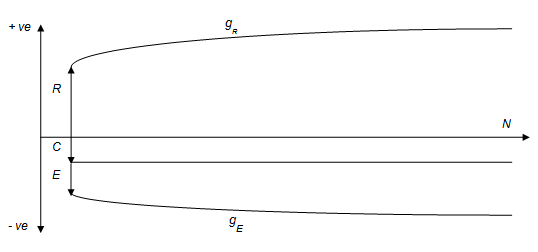
Figure: 1 Cash flow diagram for the project
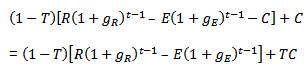
At a particular year, t, from the commencement of project operation, the amount of revenues realised in that year is R(1+gR)t-1. And, the amount of cash expenses incurred in year t is E (1+gE)t-1. Let T be the income tax rate for each year. Then, the amount of cash flow available for debt servicing in year t is:
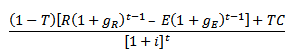
The present value of net cash flow available for debt servicing at time t can be computed by discounting. Let ‘i' be the interest rate on the debt, then the present value is:
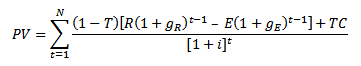
The present value, PV , of all the cash flow streams that is available during the period between project completion and the final loan repayment period, N , is obtained from summation of all the cash flows at time, t , years, where t varies from 1 to N years.
The above equation can be transformed into the following equation
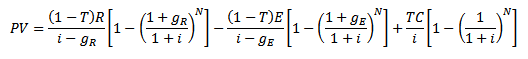
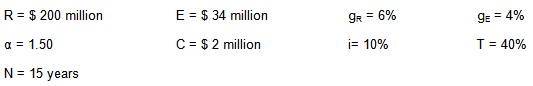
For example, suppose the project company would like to know how much debt can be raised for the project which is expected to generate $ 200 million in the first year of operation. This revenue is expected to grow at an annual rate of 6% per annum and period of operation is around 15 years. Similarly, in the first year of operation, the expected expenses has been estimated to be around $34 million and this expense is expected to grow at the rate of 4% per annum. The project will be placed in theincome tax bracket of 40% and non-cash expenses deductible for tax purposes each year is estimated to be around $2 million. The targeted coverage ratio is 1.50 and the interest rate on debt is 10%.
The values of the parameters are as follows:
Substituting these values in the above equation, the present valueof the net revenue is
PV = $1278.85 million - $ 193.42 million + $ 6.08 million
PV = $ 1091.52 million
Then, using this present value of net revenue and targeted coverage ratio, the maximum loan amount that can be raised is
![]()
Thus, the maximum amount of loan that can be raised is $ 727.68 million.