Example:
A linear regression model is formulated between the vehicles owned by the household of size five and the total number of vehicles owned by the household. The model has been formulated based on a sample of size 4. The four data points are shown in the following figure using the triangular shaped markers. Let us suppose we have the population regression function as represented by the dark line in the figure. From the four observations a sample regression function has also been estimated and is shown as the dotted line in the Figure.
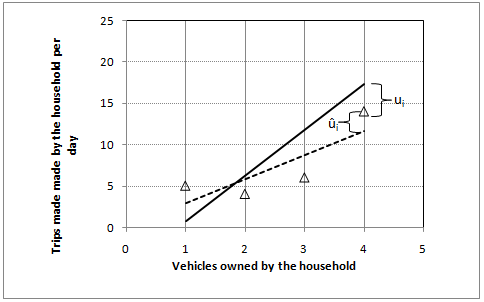
Corresponding to the household size of four the point on the dotted line represents the estimated conditional expectation of the dependent variable where as the point on the dark line represents the corresponding expected value of the dependent variable of the population data. The triangular marker is the value of Yi.
There are different methods available for estimating the parameters m and c used in the above linear regression model. Ordinary least squares method (OLS method) which minimizes the summation of the squared error in Y for different X values, is explained below.
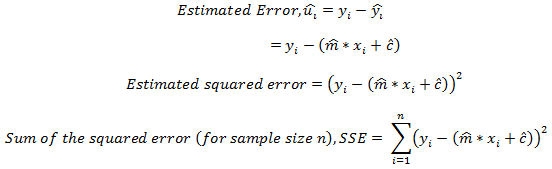
Let ![]() is the estimated value of Y for a given set of estimated parameters
is the estimated value of Y for a given set of estimated parameters![]() and given value of
and given value of ![]() The difference in the estimated and the actual values of Y is the error in estimation when the above set of parameters is used. OLS method gives a set of parameters that result in the least value for the sum of squared errors.
The difference in the estimated and the actual values of Y is the error in estimation when the above set of parameters is used. OLS method gives a set of parameters that result in the least value for the sum of squared errors.
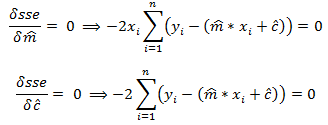
The set of parameters![]() corresponding to the minimum SSE can be obtained by differentiating SSE with respect to both the parameters and equating the resulting equations to zero.
corresponding to the minimum SSE can be obtained by differentiating SSE with respect to both the parameters and equating the resulting equations to zero.
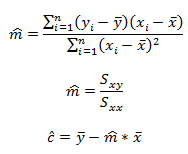
By solving the above two equations the following parameters would be obtained;