Hypotheses testing for goodness of fit
When the population distribution function is known to follow certain probability distribution this test is used for knowing the goodness-of-fit. Here also a sample data is to be collected from the population data and the frequency analysis has to be carried out on the data. The total data are divided into k classes, mostly depending upon the range of the observed data and any particular class must not have less than 8 observations. It is also necessary to calculate the parameters of the assumed probability distribution from the sample data. For example, if the time headways observed at a particular road section are assumed to follow negative exponential distribution, the mean headway is to be calculated from the observed data.
With the help of the assumed distribution and the parameters calculated from the sample data theoretical frequencies are to be generated. If Oi is the observed frequency and the Ei is the expected frequency then the following is the test statistic;
![]()
The test statistic follows chi-square distribution with k-p-1 degrees of freedom. p is the number of parameters in the assumed distribution and the 1 is used since the total frequency has been used in getting the theoretical frequency. From the assumed significance level and the degrees of freedom the critical regions are determined.
In this case the null hypothesis is ‘the assumed distribution fits to the population data at the given significance level'. If the test statistic falls in the critical region reject the null hypothesis otherwise it may be said that the analyst has failed to see any difference between the theoretical and observed frequencies hence failed to reject the null hypothesis.
As can be seen from the formula for the chi-square observed value, it always takes positive values and no information is available on the location of the differences between the observed and the theoretical frequencies.
Example
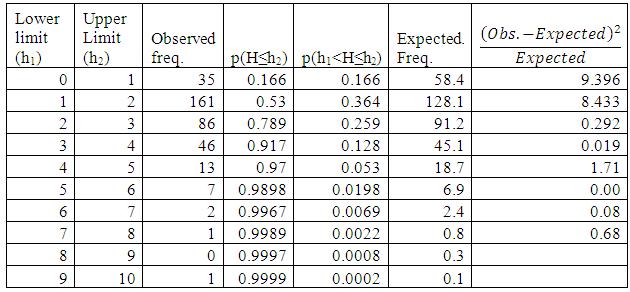
It is hypothesized that the headway data obtained from high traffic flow conditions follow Erlang distribution. To know whether it is really true or not 352 observations were obtained. The mean headway is found to be 2.18 sec and the variance is 1.56 sec2. The parameters for the Erlang distribution are 3 (shape parameter) and 1.376 (scale parameter). Obtained theoretical frequencies are tabulated in table 8.1. Theoretical frequencies are obtained using the following approximation for cumulative distribution function for the Erlang distribution.
![]()
k is the shape parameter (only integer values) and λ is the scale parameter.
Chi-square calculated is 20.61. If the null hypothesis is “observed headway data follows Erlang distribution” and the alternate hypothesis is “data won't fit into Erlang distribution” at 1% significance level the conclusion of the hypotheses testing is “failed to reject the null hypothesis”. This conclusion is based on the theoretical and calculated chi-square values. Chi-square calculated, 20.61, is less than the chi-square theoretical value, 21. 67 ( at 9 degrees of freedom and 1% significance level), results in the above decision.
Table 8.1: Sample calculations for Chi-square goodness of fit test for the headway data (assumed to follow Erlang distribution)
Other Tests for goodness-of-fit
Most of the times, it is assumed that the population data follow certain distribution (in majority of the cases it is assumed to follow normal distribution). There are also problems where the distributional assumption cannot be made on the population data. In this scenario, some non-parametric tests are available for testing the goodness-of-fit of the observed and the theoretical densities.