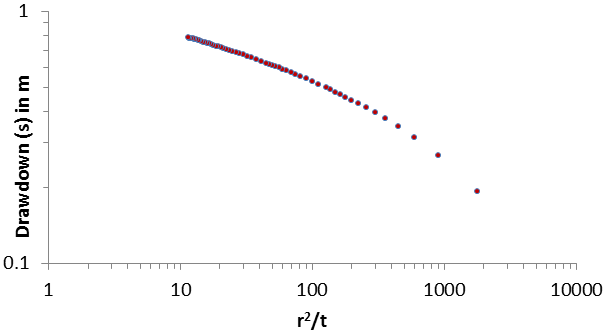
Fig. 22.1 and Fig 22.2 show the relation between W(u) and u, and r2/t and S. The r2/t and S is obtained from observed data.
-
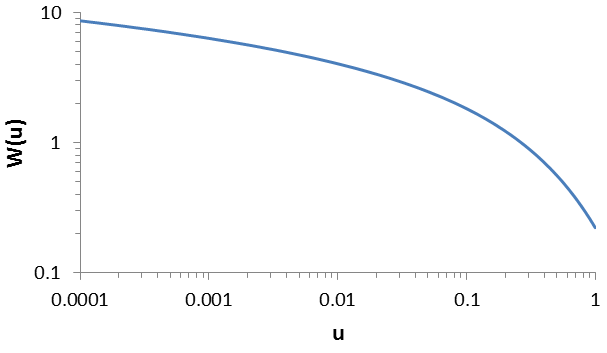 Fig.22.1 Relation between W(u) and u
 -
-
Fig 22.2 Relation between r2/t and S
-
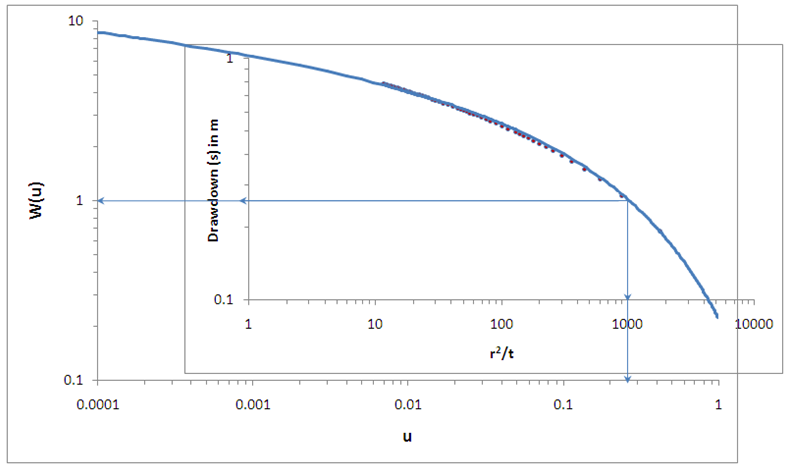
Fig 22.3 Superimposition of the relation between W(u) and u, and r2/t and S
Fig. 22.3 show the superimposed relations between the plot W(u) verses u, S verses r2/t. Considering a suitable convenient point on the superimposed curve, the values of W(u), u, Sand r2/t can be obtained. The aquifer parameters (T,Ss) can now be computed using the equations (22.2) and (22.3).