As seen from the above table, these are cost alternatives involving all cash outflows (negative cash flows) except for the salvage value (positive cash flow) at the end of useful life. The alternatives are not in the increasing order of capital investment as observed from Table 2.1. The alternatives are now arranged in the increasing order of capital investment as shown in Table 2.2 and cash outflows and cash inflows are shown with negative and positive signs respectively.
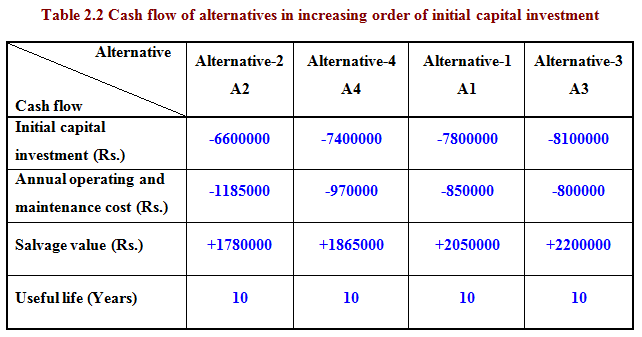
After arranging the alternatives in increasing order of capital investment, alternative-2 (A2) now becomes the base alternative (lowest capital investment with Rs.6600000) and it is compared with the next higher investment alternative i.e. alternative-4 (A4) with capital investment of Rs.7400000. The incremental cash flow between the two alternatives A2 and A4 is given as follows;
Incremental capital investment = -Rs.7400000 – (-Rs.6600000) = -Rs.800000 at beginning i.e. at time zero.
Incremental annual operating and maintenance cost from end of year 1 till end of year 10
= -Rs.970000 – (-Rs.1185000) = Rs.215000
Incremental salvage value = Rs.1865000 – Rs.1780000 = Rs.85000 at end of year 10
In order to find out the rate of return (IRR) of this incremental cash flow, the net present worth is equated to zero.
![]()