The graphical representation of the cash flows i.e. both cash outflows and cash inflows with respect to a time scale is generally referred as cash flow diagram.
A typical cash flow diagram is shown in Fig. 1.5. The cash flows are generally indicated by vertical arrows on the time scale as shown in Fig. 1.5.
The cash outflows (i.e. costs or expense) are generally represented by vertically downward arrows whereas the cash inflows (i.e. revenue or income) are represented by vertically upward arrows.
In the cash flow diagram, number of interest periods is shown on the time scale. The interest period may be a quarter, a month or a year. Since the cash flows generally occur at different time intervals within an interest period, for ease of calculation, all the cash flows are assumed to occur at the end of an interest period. Thus in Fig. 1.5, the numbers on the time scale represent the end of year (EOY).
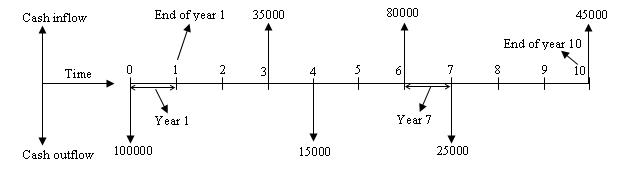 |
Fig 1.5 Cash flow diagram |
In Fig. 1.5 the cash outflows are Rs.10,00,00, Rs.15,000 and Rs.25,000 occurring at end of year (EOY) ‘0’ i.e. at the beginning, EOY ‘4’ and EOY ‘7’ respectively. Similarly the cash inflows Rs.35,000, Rs.80000 and Rs.45,000 are occurring at EOY ‘3’, EOY ‘6’ and EOY ‘10’ respectively.
Compound interest factors:
The compound interest factors and the corresponding formulas are used to find out the unknown amounts at a given interest rate continued for certain interest periods from the known values of varying cash flows. The following are the notations used for deriving the compound interest factors.
P = Present worth or present value
F = Future worth or future sum
A = Uniform annual worth or equivalent uniform annual worth of a uniform series continuing over a specified number of interest periods
n = number of interest periods (years or months)
i = rate of interest per interest period i.e. % per year or % per month
Unless otherwise stated, the rate of interest is compound interest and is for the entire number of interest periods i.e. for ‘n’ interest periods.
The present worth (P), future worth (F) and uniform annual worth (A) are shown in Fig. 1.6.
In this figure the present worth, P is at the beginning and the uniform annual series with annual value ‘A’ is from end of year 1 till end of year 5. Both ‘P’ and ‘A’ are cash outflows. It may be noted that the uniform annual series with annual value ‘A’ may be also continued throughout the entire interest periods i.e. from beginning till end of year 10 or for some intermediate interest periods like commencing from end of year 3 till end of year 8.
The future worth ‘F’ is occurring at end of year 4 (cash outflow), at end of year 6 (cash inflow) and at the end of year 10 (cash inflow).
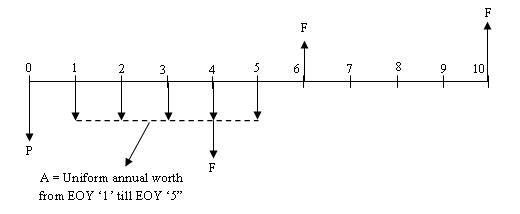 |
Fig 1.6 Cash flow diagram showing P, F and A |
While deriving the different compound interest factors, it is assumed that the interest is compounded once per interest period i.e. discrete compounding. Further the cash flows are assumed to be discrete i.e. they occur at the end of interest period.