|
Time space diagram is a convenient tool in understanding the movement of
vehicles.
It shows the trajectory of vehicles in the form of a two dimensional plot.
Time space diagram can be plotted for a single vehicle as well as multiple
vehicles.
They are discussed below.
Taking one vehicle at a time, analysis can be carried out on the position of
the vehicle with respect to time.
This analysis will generate a graph which gives the relation of its position on
a road stretch relative to time.
This plot thus will be between distance  and time and time  and will be a
functions the position of the vehicle for every t along the road stretch.
This graphical representation of and will be a
functions the position of the vehicle for every t along the road stretch.
This graphical representation of  in a in a  plane is a curve which is
called as a trajectory.
The trajectory provide an intuitive, clear, and complete summary of vehicular
motion in one dimension. plane is a curve which is
called as a trajectory.
The trajectory provide an intuitive, clear, and complete summary of vehicular
motion in one dimension.
Figure 1:
Time space diagram for a single vehicle
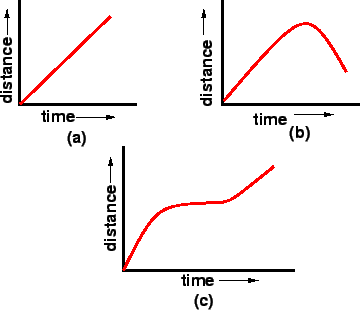 |
In figure 1(a), the the distance goes on increasing with
respect to the origin as time progresses.
The vehicle is moving at a smooth condition along the road way.
In figure 1(b), the vehicle at first moves with a smooth
pace after reaching a position reverses its direction of movement.
In figure 1(c), the vehicle in between becomes stationary and
maintains the same position.
From the figure, steeply increasing section of denote a rapidly
advancing vehicle and horizontal portions of denote a stopped vehicle
while shallow sections show a slow-moving vehicle.
A straight line denotes constant speed motion and curving sections denote
accelerated motion; and if the curve is concave downwards it denotes
acceleration.
But a curve which is convex upwards denotes deceleration.
|