If we calculate the values of  for different for different values, a table can be drawn as follows, values, a table can be drawn as follows,
Table 5.1: Variation of with
|
|
1 |
0 |
3 |
10-17 |
4 |
0.15 |
4.5 |
103 |
A graph can be plotted with these values which are shown in the Figure 5.3.
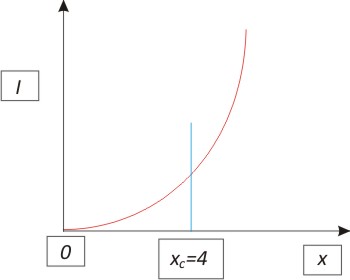
Fig.5.3: Plot of rate of nucleation versus
As seen from the table and the above figure that for the pressure ratio  goes between 4 to 4.5 there is a sharp rise in the rate of nucleation, we can infer that for achieving a considerable degree of nucleation, a certain minimum degree of super-saturation is necessary. goes between 4 to 4.5 there is a sharp rise in the rate of nucleation, we can infer that for achieving a considerable degree of nucleation, a certain minimum degree of super-saturation is necessary.
|