·
From the Figure 7.8: ![]() ; Rmin = 0.67 for xD =0.95
; Rmin = 0.67 for xD =0.95
Here, reflux ratio , R =2.5 × Rmin =2.5 ×0.67= 1.675 is taken for this design.
Average molecular wt. of feed= 0.5×58 + 0.5×18=38
Molar feed flow (F) rate=25,000/38=657.9 kmol/h
Acetone balance: ![]() ⇒
⇒ ![]() kmol/h
kmol/h
Vapor flow (V) rate above feed plate,![]() 926.2 kmol/h
926.2 kmol/h
(Assuming constant molar overflow)
Top section liquid flow rate, L = V - D = 580 kmol/h
Bottom product: B = F - D = 657.9 - 346.2 = 311.7 kmol/h
Mass balance below feed plate:![]()
Slope of the bottom section operating line (Figure 7.8): ![]()
![]() = Liquid flow rate below feed plate = 1285.7 kmol/h
= Liquid flow rate below feed plate = 1285.7 kmol/h
![]() = Vapor flow rate below feed plate = 974 kmol/h
= Vapor flow rate below feed plate = 974 kmol/h
The construction of operating lines and number of theoretical stages are shown in this Figure 7.8.
Total number of tray= 6 (above feed) +3 (below feed) = 9
Total number of real stages ![]() (60% column efficiency; reboiler was considered as equivalent to one theoretical tray)
(60% column efficiency; reboiler was considered as equivalent to one theoretical tray)
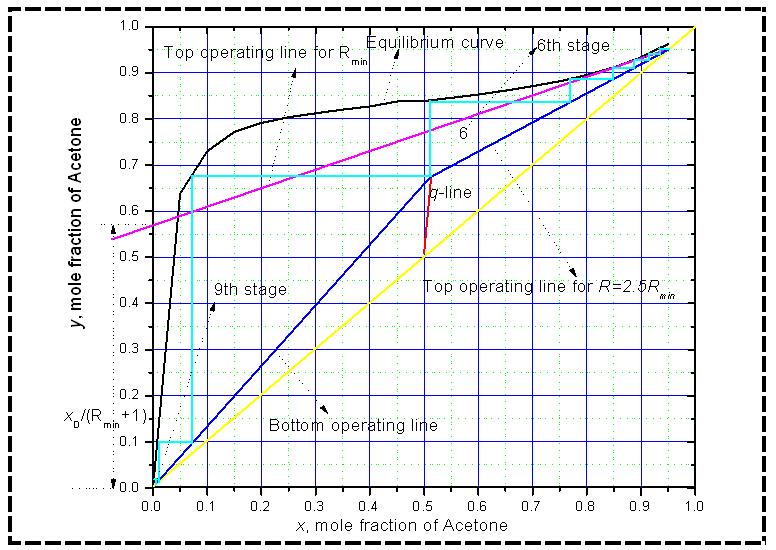
Figure 7.8: McCabe-Thiele construction.