Surface area, pore size, pore volume determination
Determination of surface area and pore distribution of catalysts is important to understand the extent of dispersion possible for the active metals. Higher surface area of support results in higher dispersion of the active metals. Hence supports of higher surface area are desirable. Pores are usually formed during drying or calcination of hydroxides precipitates or gel. The size and number of pores determines the internal surface area. Pore size also determines the accessibility of reactants to the active sites and the ability of diffusion of products back to the bulk fluid. Hence pore structure and surface area must be optimized to provide maximum utilization of active sites for a given feed stock.
Working principle and instrumentation
The basic components of volumetric physical adsorption analyzer as shown in Fig. 1 are:
1) Analysis manifold of accurately known volume and temperature
2) Vacuum system with valve to manifold
3) Source of adsorptive gas (typically, N2) with valve to manifold
4) Pressure transducer and temperature sensor
5) Sample tube connected to analysis manifold
6) Liquid nitrogen bath
Determination of internal surface area is based on adsorption and condensation of N2 at liquid N2 temperature, 77K. Initially, the sample is e vacuated at 293-523 K (120-250°C) followed by c ooling to 77 K by liquid N2. Then gradually the partial pressure of nitrogen above the sample is increased. S ome quantity of gas will be adsorbed by the sample and removed from the gas phase. After stabilization the equilibrated pressure is recorded and a mount of nitrogen adsorbed at each equilibrated pressure is noted. The isotherm, volume adsorbed as function of relative pressure p/po, is plotted from the data. The pressure over the sample is gradually increased until pressure reaches near saturation pressure, by when the complete adsorption isotherm is developed. The desorption isotherm is measured by a step-wise reduction in pressure until a low pressure over the sample is achieved. Although the volumes are adsorbed at different conditions, the values are reported at STP conditions. Fig. 2 shows a typical N2 adsorption and desorption isotherm at 77 K for alumina.
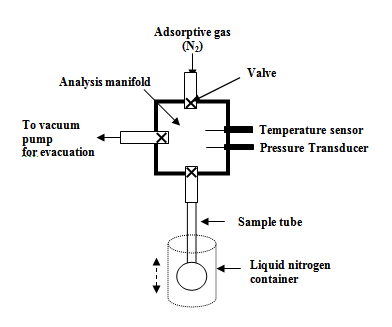
Fig. 1. Basic components of volumetric physical adsorption analyzer
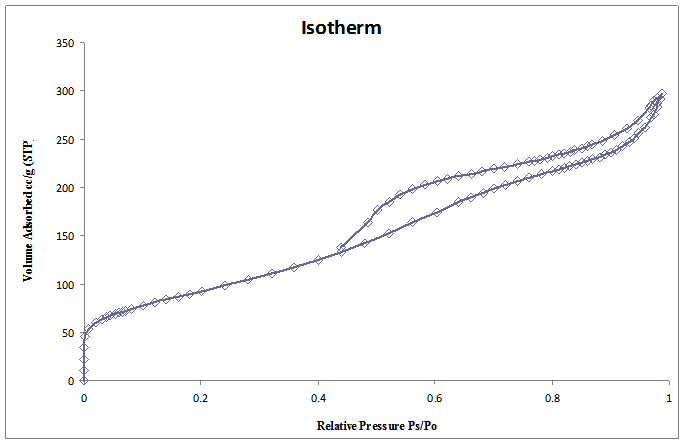
Fig. 2. A typical N2 adsorption and desorption isotherm at 77 K for alumina
Adsorption using Argon and Krypton
Krypton is used as adsorbate at 77 K for low surface area analysis while, Argon adsorption at 77 K and liquid argon temperature (87K) is often used for micro and mesopores analysis.
To measure very low surface area the number of molecules trapped in the void volume of sample cell needs to be reduced. The number of molecules left in void volume can be reduced by using adsorbate such as Krypton with low vapor pressure at liquid nitrogen temperature. The saturation pressure of Krypton at liquid nitrogen temperature is 0.35 kPa which is much lower compared to that of N2 (101.3 kPa). Consequently the number of Krypton molecules in free space of sample cell, at any given relative pressure, is significantly reduced compared to that of nitrogen at liquid nitrogen temperature, though amount of adsorption will be only slightly less. Hence, Krypton adsorption at 77 K is much more sensitive and can be applied to measure surface areas down to 0.05 m2. The cross sectional area used for Krypton is 0.202 nm2.
For analysis of ultramicropores less 0.7 nm, the nitrogen adsorption at 77 K is not satisfactory. The pore width of 0.7 nm corresponds to bilayer thickness of nitrogen molecule. For ultramicropores, pore filling occurs at relative pressure of 10-7 to 10-5, where the rate of diffusion and attainment of adsorption equilibration is very slow. Consequently measurement becomes time consuming and may also cause non-equilibrated adsorption isotherms with erroneous results. On the other hand argon fills the micropores of dimension 0.4-0.8 nm in most cases at much higher relative pressure as compared to nitrogen. This leads to accelerated diffusion and equilibration process and result in reduction of analysis time as well as increase in accuracy. Argon adsorption is advantageous for pore size analysis of zeolites and other microporous materials.
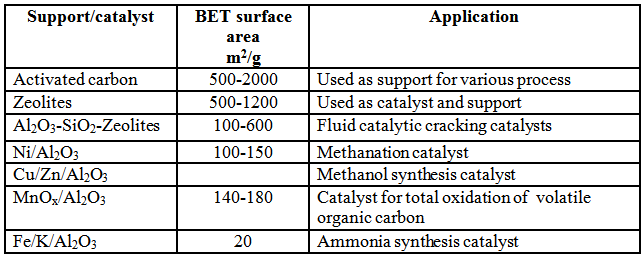
The typical surface area values of different supports and catalysts are summarized in Table 1.
Table 1. Typical surface area values of different support and catalyst.
Determination of surface area using BET Equation
As discussed earlier (lecture 4), the BET equation describes the relationship between volume adsorbed at a given partial pressure and the volume adsorbed at monolayer coverage. BET equation can be written in the form :
p = partial pressure of N2; p0 = saturation pressure at the experimental temperature;
v = volume adsorbed at p; vm = volume adsorbed at monolayer coverage; c = constant
Monolayer coverage is determined using BET equation. The ![]() is plotted as a function of
is plotted as a function of ![]() . The plot is linear in the range of relative pressures
. The plot is linear in the range of relative pressures ![]() = 0.05 - 0.3. At higher relative pressure p/po, the BET plot deviates from linearity as non-ideality or pore condensation was not accounted for the derivation of BET equation.
= 0.05 - 0.3. At higher relative pressure p/po, the BET plot deviates from linearity as non-ideality or pore condensation was not accounted for the derivation of BET equation.
Slope and intercept of this linear plot is used for determination of monolayer capacity vm.
The intercept and slope from the plot is given as
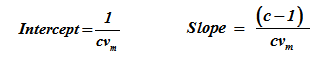
Then the monolayer volume vm is given as, ![]()
The total number of N2 molecules adsorbed corresponding to monolayer volume vm can be calculated as
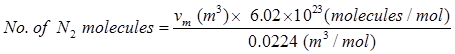
Now each adsorbed N2 molecule occupies an area of surface comparable to its cross section area 0.162 nm2.

or ![]()