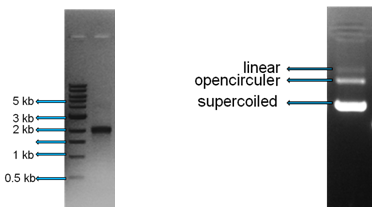
...Fig. 3: PCR amplified linear fragment of... Fig. 4: Plasmid DNA checked on agarose gel
....DNA run parallel with standard marker. ..........showing all the three conformations.
Analyzing a Gel
Generally agarose gels are visualized using a standard control to check for whether bands have generated or not. Bands that are closer to the wells are more compressed than bands away from the wells. Standard marker helps in finding the approximate size of the linear fragments of DNA. Linear duplex DNA fragments travel through agarose gels at a rate which is inversely proportional to the log of their molecular weight.
Example 1: Compare molecular mass vs. expected migration rate:
Molecular Mass
(kDa)
|
log
(Molec. Mass) |
1/log (Molec. Mass)
i.e. relative Mr (Migration Rate)
|
| 20000 |
4.3 |
0.23 |
| 15000 |
4.1 |
0.24 |
| 10000 |
4.0 |
0.25 |
| 5000 |
3.7 |
0.27 |
| 1000 |
3.0 |
0.33 |
|